29
/
en
AIzaSyAYiBZKx7MnpbEhh9jyipgxe19OcubqV5w
April 1, 2024
49871
Middle East & North Africa (IDA & IBRD countries)
TMN
false
2
1
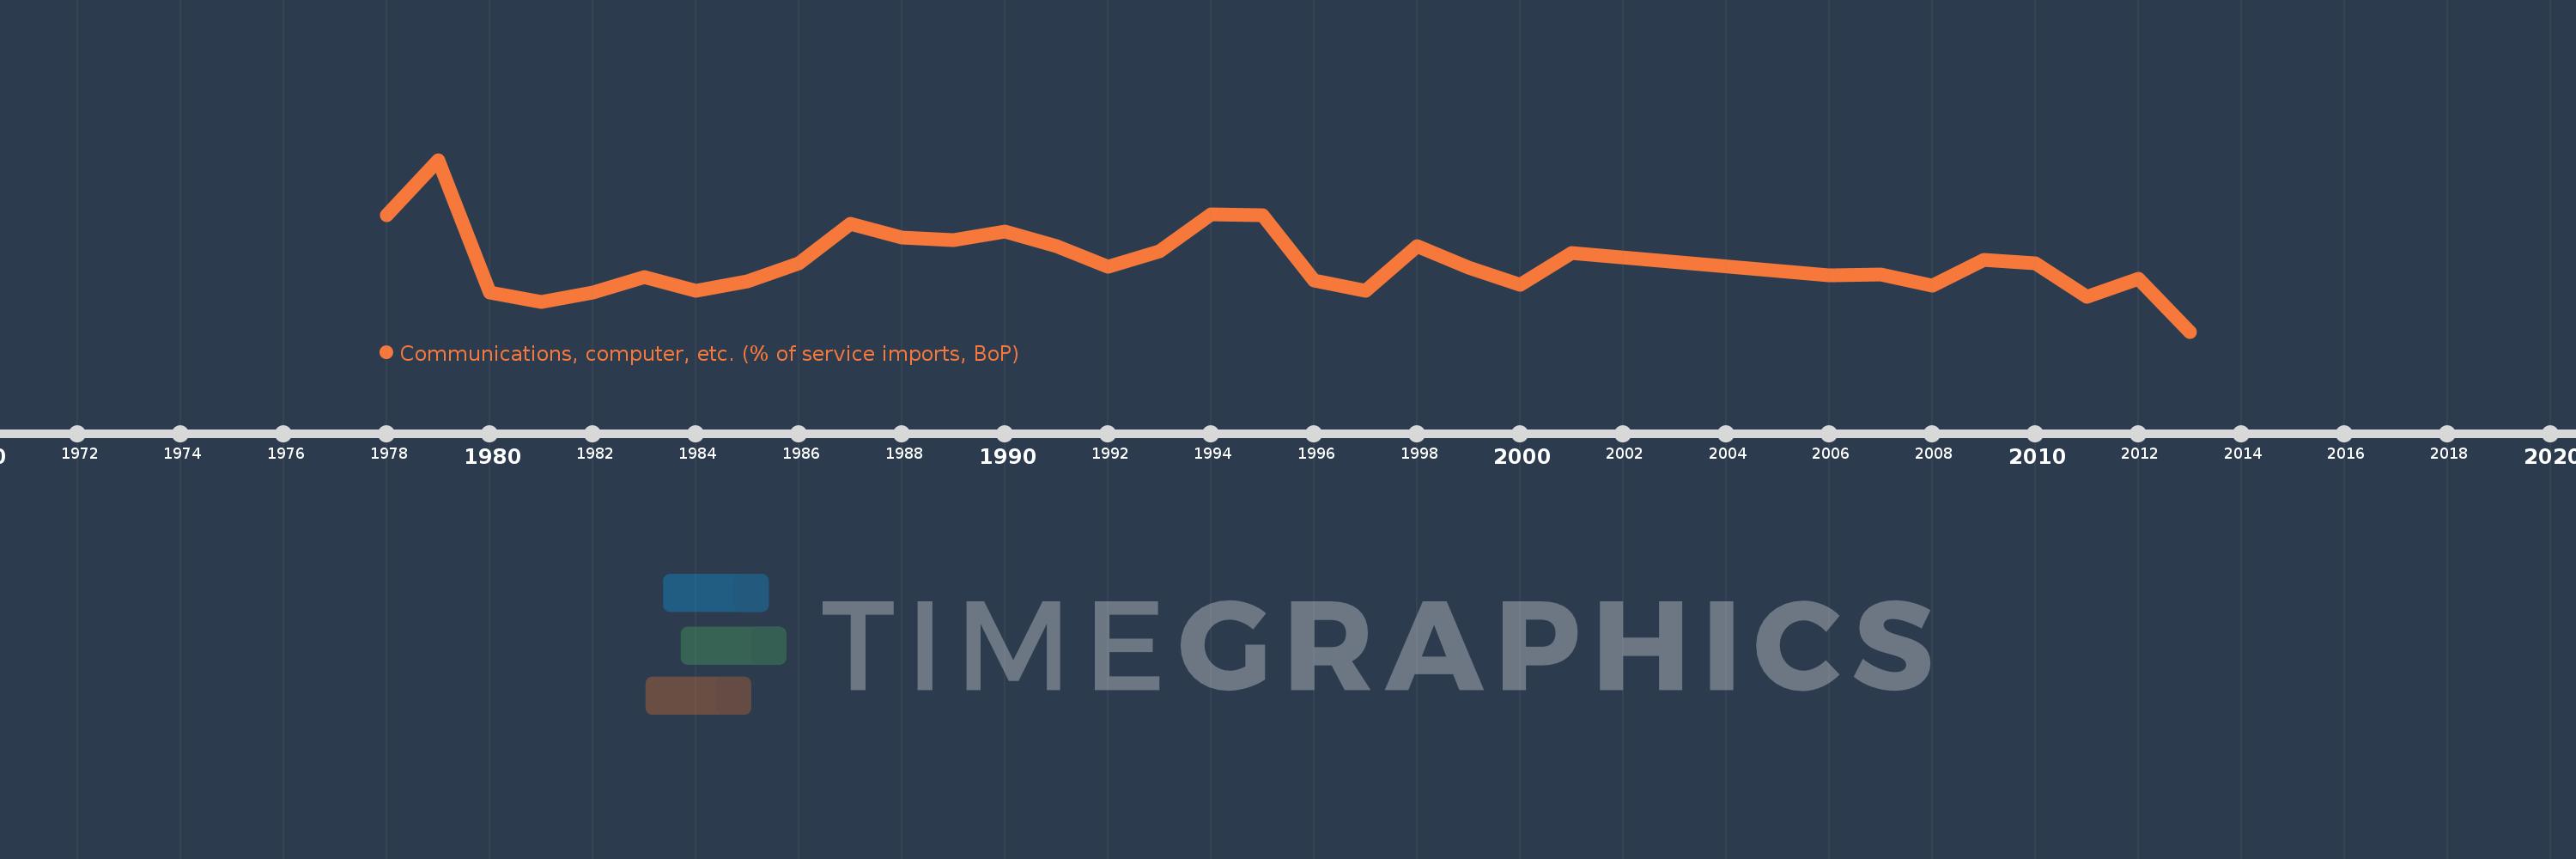
Communications, computer, etc. (% of service imports, BoP)
2013,2012,2011,2010,2009,2008,2007,2006,2001,2000,1999,1998,1997,1996,1995,1994,1993,1992,1991,1990,1989,1988,1987,1986,1985,1984,1983,1982,1981,1980,1979,1978
This statistics in other country:
AfghanistanAlbaniaAlgeriaAngolaAntigua and BarbudaArab WorldArgentinaArmeniaArubaAustraliaAustriaAzerbaijanBahamas, TheBahrainBangladeshBarbadosBelarusBelgiumBelizeBeninBermudaBhutanBoliviaBosnia and HerzegovinaBotswanaBrazilBrunei DarussalamBulgariaBurkina FasoBurundiCabo VerdeCambodiaCameroonCanadaCaribbean small statesCentral African RepublicCentral Europe and the BalticsChadChileChinaColombiaComorosCongo, Dem. Rep.Congo, Rep.Costa RicaCote d'IvoireCroatiaCuracaoCyprusCzech RepublicDenmarkDjiboutiDominicaDominican RepublicEarly-demographic dividendEast Asia & PacificEast Asia & Pacific (excluding high income)East Asia & Pacific (IDA & IBRD countries)EcuadorEgypt, Arab Rep.El SalvadorEquatorial GuineaEritreaEstoniaEthiopiaEuro areaEurope & Central AsiaEurope & Central Asia (excluding high income)Europe & Central Asia (IDA & IBRD countries)European UnionFaroe IslandsFijiFinlandFragile and conflict affected situationsFranceFrench PolynesiaGabonGambia, TheGeorgiaGermanyGhanaGreeceGrenadaGuatemalaGuineaGuinea-BissauGuyanaHaitiHeavily indebted poor countries (HIPC)High incomeHondurasHong Kong SAR, ChinaHungaryIBRD onlyIcelandIDA & IBRD totalIDA onlyIDA totalIndiaIndonesiaIran, Islamic Rep.IraqIrelandIsraelItalyJamaicaJapanJordanKazakhstanKenyaKiribatiKorea, Rep.KosovoKuwaitKyrgyz RepublicLao PDRLate-demographic dividendLatin America & Caribbean Latin America & Caribbean (excluding high income)Latin America & the Caribbean (IDA & IBRD countries)LatviaLeast developed countries: UN classificationLebanonLesothoLiberiaLibyaLithuaniaLow & middle incomeLow incomeLower middle incomeLuxembourgMacao SAR, ChinaMacedonia, FYRMadagascarMalawiMalaysiaMaldivesMaliMaltaMarshall IslandsMauritaniaMauritiusMexicoMicronesia, Fed. Sts.Middle East & North AfricaMiddle East & North Africa (excluding high income)Middle East & North Africa (IDA & IBRD countries)Middle incomeMoldovaMongoliaMontenegroMoroccoMozambiqueMyanmarNamibiaNepalNetherlandsNew CaledoniaNew ZealandNicaraguaNigerNigeriaNorth AmericaNorwayOECD membersOmanOther small statesPacific island small statesPakistanPalauPanamaPapua New GuineaParaguayPeruPhilippinesPolandPortugalPost-demographic dividendPre-demographic dividendQatarRomaniaRussian FederationRwandaSamoaSao Tome and PrincipeSaudi ArabiaSenegalSerbiaSeychellesSierra LeoneSingaporeSint Maarten (Dutch part)Slovak RepublicSloveniaSmall statesSolomon IslandsSouth AfricaSouth AsiaSouth Asia (IDA & IBRD)South SudanSpainSri LankaSt. Kitts and NevisSt. LuciaSt. Vincent and the GrenadinesSub-Saharan Africa Sub-Saharan Africa (excluding high income)Sub-Saharan Africa (IDA & IBRD countries)SudanSurinameSwazilandSwedenSwitzerlandSyrian Arab RepublicTajikistanTanzaniaThailandTimor-LesteTogoTongaTrinidad and TobagoTunisiaTurkeyTuvaluUgandaUkraineUnited KingdomUnited StatesUpper middle incomeUruguayVanuatuVenezuela, RBWest Bank and GazaWorldYemen, Rep.ZambiaZimbabwe Timeline:
This timeline shows a graph from 1978 to 2013 of Middle East & North Africa (IDA & IBRD countries). No data until 1977. Number of actual observations by date: 32.
Source name:
World Development Indicators
Source organization:
International Monetary Fund, Balance of Payments Statistics Yearbook and data files.
Categories, topics:
Economy & Growth, Trade
Last updated:
apr 23, 2017
Indicators value changes by year
Minimum:
27.771
jan 1, 2013
Maximum:
51.238
jan 1, 1979
At the date of observation
Value
Absolute change
Change from previous value
jan 1, 1978
43.69
+43.69
0.0%
jan 1, 1979
51.238
+7.548
17.28%
jan 1, 1980
33.055
-18.183
-35.49%
jan 1, 1981
31.829
-1.226
-3.71%
jan 1, 1982
33.154
+1.325
4.16%
jan 1, 1983
35.197
+2.043
6.16%
jan 1, 1984
33.401
-1.796
-5.1%
jan 1, 1985
34.621
+1.22
3.65%
jan 1, 1986
37.065
+2.444
7.06%
jan 1, 1987
42.444
+5.379
14.51%
jan 1, 1988
40.647
-1.797
-4.23%
jan 1, 1989
40.258
-0.389
-0.96%
jan 1, 1990
41.447
+1.189
2.95%
jan 1, 1991
39.471
-1.976
-4.77%
jan 1, 1992
36.683
-2.788
-7.06%
jan 1, 1993
38.716
+2.033
5.54%
jan 1, 1994
43.778
+5.062
13.07%
jan 1, 1995
43.711
-0.067
-0.15%
jan 1, 1996
34.729
-8.982
-20.55%
jan 1, 1997
33.319
-1.41
-4.06%
jan 1, 1998
39.503
+6.184
18.56%
jan 1, 1999
36.504
-2.999
-7.59%
jan 1, 2000
34.218
-2.286
-6.26%
jan 1, 2001
38.518
+4.3
12.57%
jan 1, 2006
35.438
-3.08
-8.0%
jan 1, 2007
35.628
+0.189
0.53%
jan 1, 2008
34.093
-1.535
-4.31%
jan 1, 2009
37.564
+3.471
10.18%
jan 1, 2010
37.157
-0.407
-1.08%
jan 1, 2011
32.565
-4.592
-12.36%
jan 1, 2012
34.94
+2.374
7.29%
jan 1, 2013
27.771
-7.169
-20.52%
Ranking of countries by current statistics by years


Comments: