29
/
en
AIzaSyAYiBZKx7MnpbEhh9jyipgxe19OcubqV5w
April 1, 2024
44911
Low & middle income
LMY
false
2
1
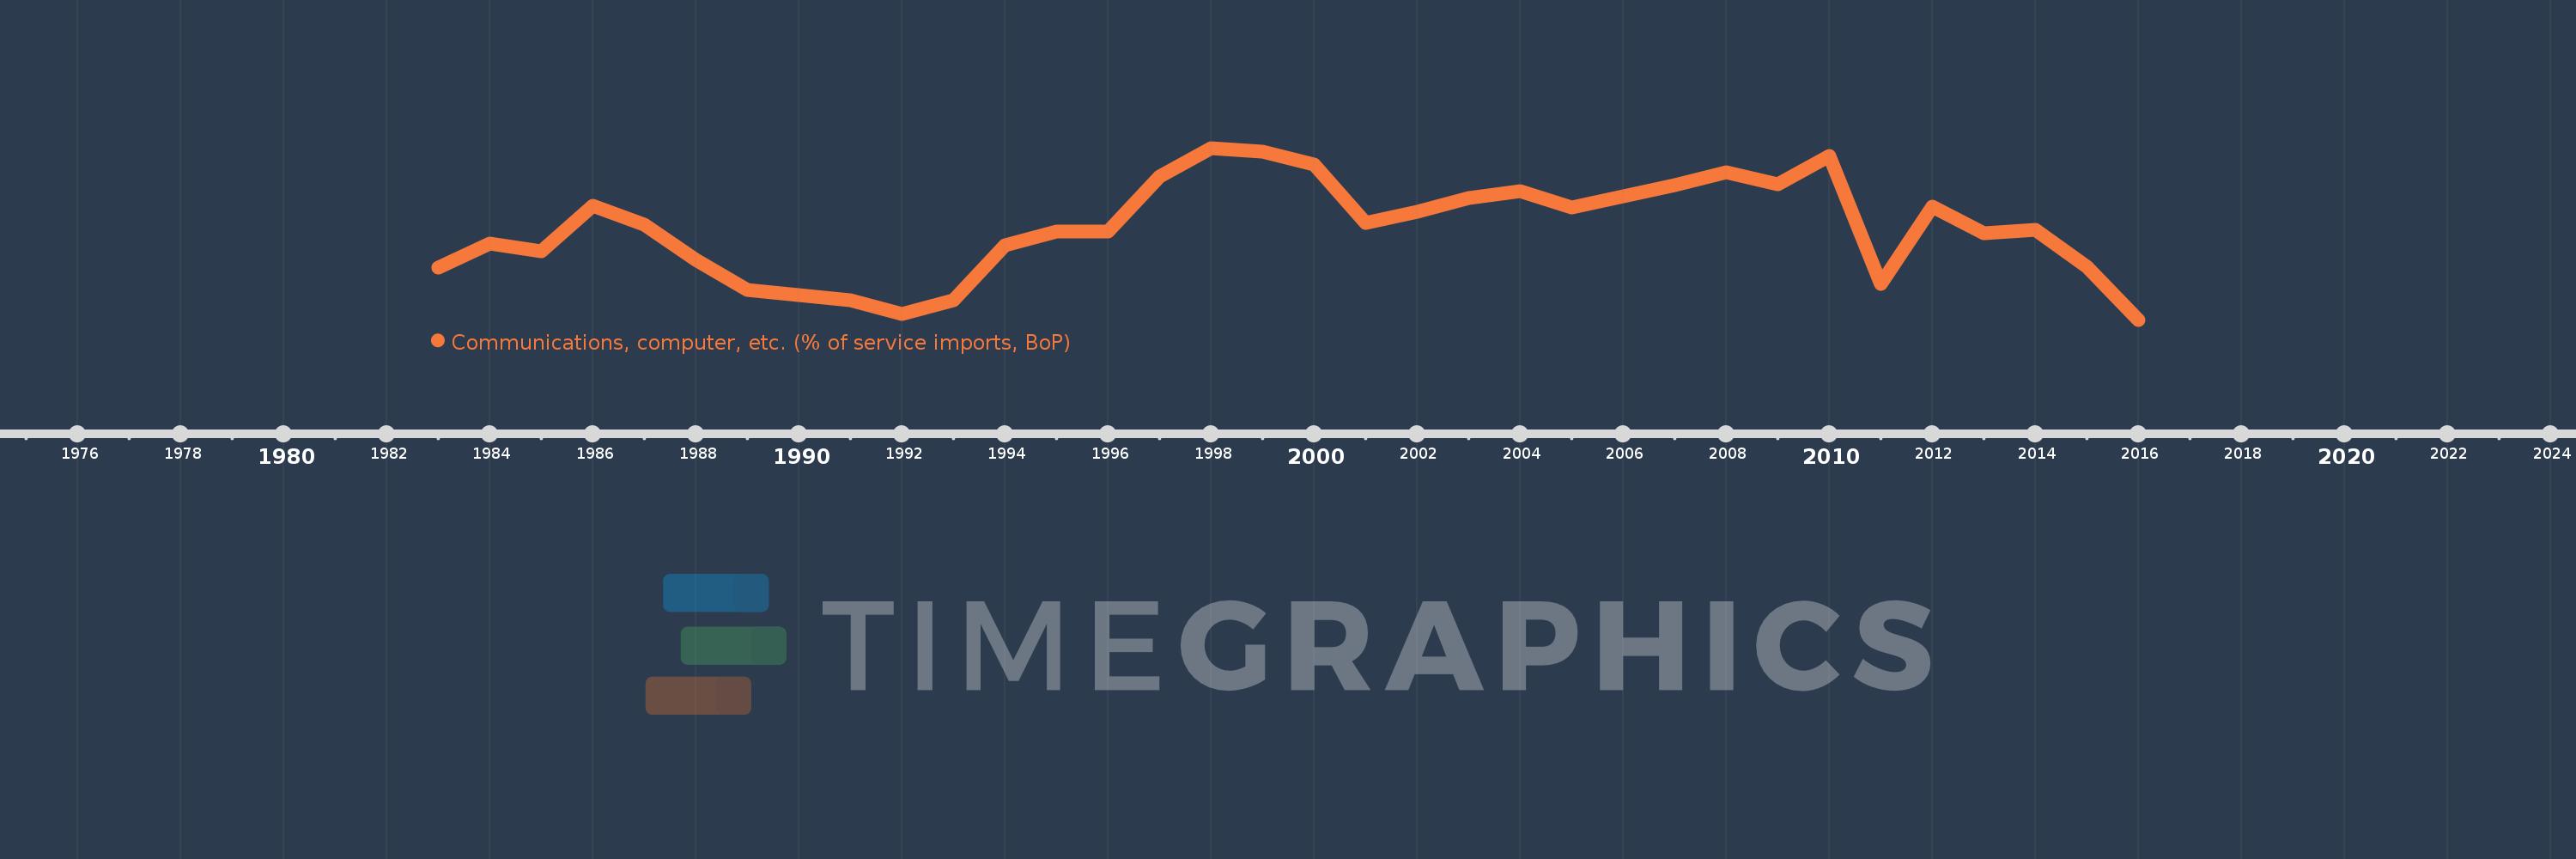
Communications, computer, etc. (% of service imports, BoP)
2016,2015,2014,2013,2012,2011,2010,2009,2008,2007,2006,2005,2004,2003,2002,2001,2000,1999,1998,1997,1996,1995,1994,1993,1992,1991,1990,1989,1988,1987,1986,1985,1984,1983
This statistics in other country:
AfghanistanAlbaniaAlgeriaAngolaAntigua and BarbudaArab WorldArgentinaArmeniaArubaAustraliaAustriaAzerbaijanBahamas, TheBahrainBangladeshBarbadosBelarusBelgiumBelizeBeninBermudaBhutanBoliviaBosnia and HerzegovinaBotswanaBrazilBrunei DarussalamBulgariaBurkina FasoBurundiCabo VerdeCambodiaCameroonCanadaCaribbean small statesCentral African RepublicCentral Europe and the BalticsChadChileChinaColombiaComorosCongo, Dem. Rep.Congo, Rep.Costa RicaCote d'IvoireCroatiaCuracaoCyprusCzech RepublicDenmarkDjiboutiDominicaDominican RepublicEarly-demographic dividendEast Asia & PacificEast Asia & Pacific (excluding high income)East Asia & Pacific (IDA & IBRD countries)EcuadorEgypt, Arab Rep.El SalvadorEquatorial GuineaEritreaEstoniaEthiopiaEuro areaEurope & Central AsiaEurope & Central Asia (excluding high income)Europe & Central Asia (IDA & IBRD countries)European UnionFaroe IslandsFijiFinlandFragile and conflict affected situationsFranceFrench PolynesiaGabonGambia, TheGeorgiaGermanyGhanaGreeceGrenadaGuatemalaGuineaGuinea-BissauGuyanaHaitiHeavily indebted poor countries (HIPC)High incomeHondurasHong Kong SAR, ChinaHungaryIBRD onlyIcelandIDA & IBRD totalIDA onlyIDA totalIndiaIndonesiaIran, Islamic Rep.IraqIrelandIsraelItalyJamaicaJapanJordanKazakhstanKenyaKiribatiKorea, Rep.KosovoKuwaitKyrgyz RepublicLao PDRLate-demographic dividendLatin America & Caribbean Latin America & Caribbean (excluding high income)Latin America & the Caribbean (IDA & IBRD countries)LatviaLeast developed countries: UN classificationLebanonLesothoLiberiaLibyaLithuaniaLow & middle incomeLow incomeLower middle incomeLuxembourgMacao SAR, ChinaMacedonia, FYRMadagascarMalawiMalaysiaMaldivesMaliMaltaMarshall IslandsMauritaniaMauritiusMexicoMicronesia, Fed. Sts.Middle East & North AfricaMiddle East & North Africa (excluding high income)Middle East & North Africa (IDA & IBRD countries)Middle incomeMoldovaMongoliaMontenegroMoroccoMozambiqueMyanmarNamibiaNepalNetherlandsNew CaledoniaNew ZealandNicaraguaNigerNigeriaNorth AmericaNorwayOECD membersOmanOther small statesPacific island small statesPakistanPalauPanamaPapua New GuineaParaguayPeruPhilippinesPolandPortugalPost-demographic dividendPre-demographic dividendQatarRomaniaRussian FederationRwandaSamoaSao Tome and PrincipeSaudi ArabiaSenegalSerbiaSeychellesSierra LeoneSingaporeSint Maarten (Dutch part)Slovak RepublicSloveniaSmall statesSolomon IslandsSouth AfricaSouth AsiaSouth Asia (IDA & IBRD)South SudanSpainSri LankaSt. Kitts and NevisSt. LuciaSt. Vincent and the GrenadinesSub-Saharan Africa Sub-Saharan Africa (excluding high income)Sub-Saharan Africa (IDA & IBRD countries)SudanSurinameSwazilandSwedenSwitzerlandSyrian Arab RepublicTajikistanTanzaniaThailandTimor-LesteTogoTongaTrinidad and TobagoTunisiaTurkeyTuvaluUgandaUkraineUnited KingdomUnited StatesUpper middle incomeUruguayVanuatuVenezuela, RBWest Bank and GazaWorldYemen, Rep.ZambiaZimbabwe Timeline:
This timeline shows a graph from 1983 to 2016 of Low & middle income. No data until 1982. Number of actual observations by date: 34.
Source name:
World Development Indicators
Source organization:
International Monetary Fund, Balance of Payments Statistics Yearbook and data files.
Categories, topics:
Economy & Growth, Trade
Last updated:
apr 23, 2017
Indicators value changes by year
Minimum:
29.402
jan 1, 2016
Maximum:
37.128
jan 1, 1998
At the date of observation
Value
Absolute change
Change from previous value
jan 1, 1983
31.736
+31.736
0.0%
jan 1, 1984
32.822
+1.086
3.42%
jan 1, 1985
32.482
-0.339
-1.03%
jan 1, 1986
34.517
+2.035
6.26%
jan 1, 1987
33.692
-0.825
-2.39%
jan 1, 1988
32.108
-1.584
-4.7%
jan 1, 1989
30.742
-1.366
-4.25%
jan 1, 1990
30.527
-0.215
-0.7%
jan 1, 1991
30.287
-0.241
-0.79%
jan 1, 1992
29.68
-0.607
-2.0%
jan 1, 1993
30.279
+0.599
2.02%
jan 1, 1994
32.762
+2.483
8.2%
jan 1, 1995
33.357
+0.595
1.82%
jan 1, 1996
33.365
+0.007
0.02%
jan 1, 1997
35.829
+2.464
7.39%
jan 1, 1998
37.128
+1.299
3.63%
jan 1, 1999
36.971
-0.157
-0.42%
jan 1, 2000
36.375
-0.597
-1.61%
jan 1, 2001
33.74
-2.635
-7.24%
jan 1, 2002
34.277
+0.537
1.59%
jan 1, 2003
34.871
+0.594
1.73%
jan 1, 2004
35.204
+0.333
0.95%
jan 1, 2005
34.469
-0.735
-2.09%
jan 1, 2006
34.97
+0.501
1.45%
jan 1, 2007
35.468
+0.499
1.43%
jan 1, 2008
36.054
+0.585
1.65%
jan 1, 2009
35.483
-0.571
-1.58%
jan 1, 2010
36.788
+1.305
3.68%
jan 1, 2011
31.005
-5.783
-15.72%
jan 1, 2012
34.495
+3.49
11.26%
jan 1, 2013
33.277
-1.218
-3.53%
jan 1, 2014
33.46
+0.183
0.55%
jan 1, 2015
31.786
-1.675
-5.0%
jan 1, 2016
29.402
-2.384
-7.5%
Ranking of countries by current statistics by years


Comments: