29
/
en
AIzaSyAYiBZKx7MnpbEhh9jyipgxe19OcubqV5w
April 1, 2024
223326
Philippines
PHL
true
2
1
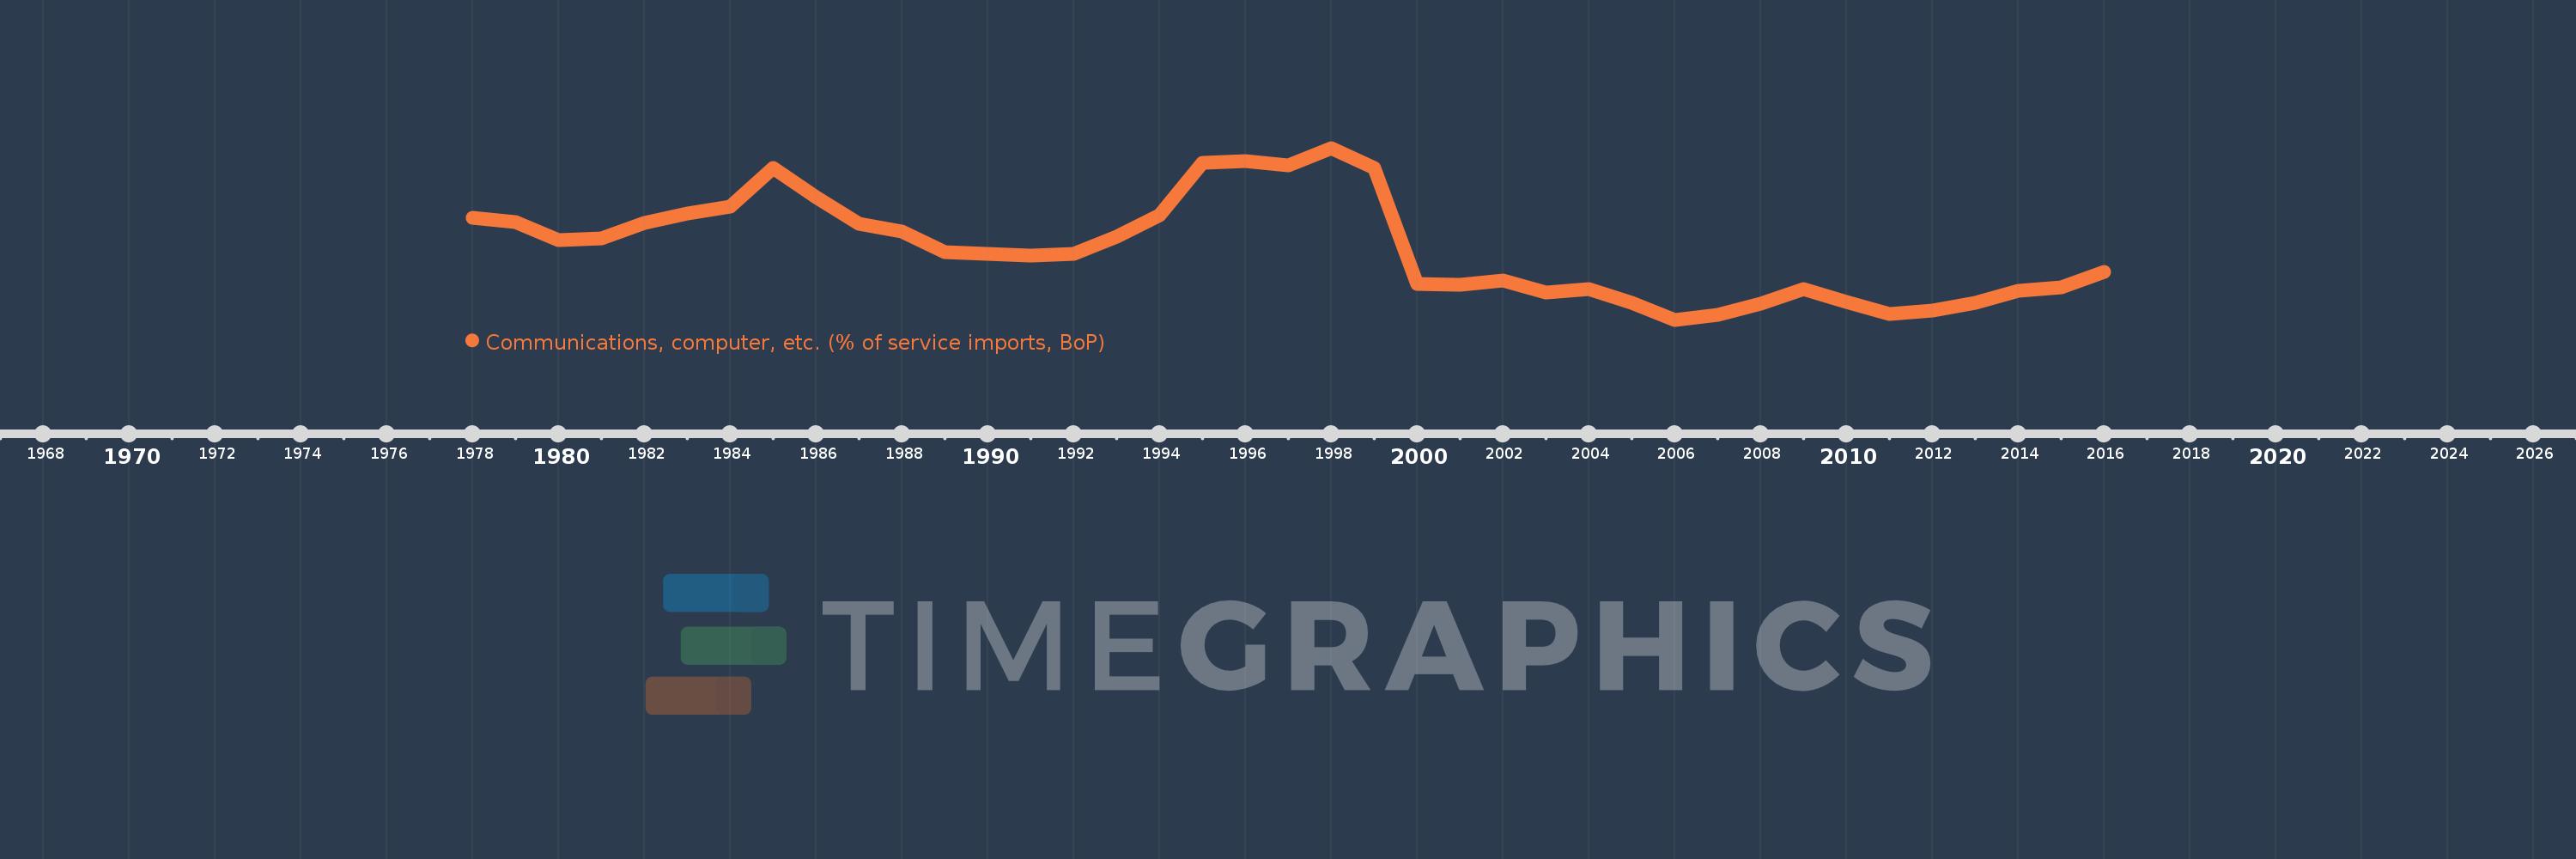
Communications, computer, etc. (% of service imports, BoP)
2016,2015,2014,2013,2012,2011,2010,2009,2008,2007,2006,2005,2004,2003,2002,2001,2000,1999,1998,1997,1996,1995,1994,1993,1992,1991,1990,1989,1988,1987,1986,1985,1984,1983,1982,1981,1980,1979,1978
This statistics in other country:
AfghanistanAlbaniaAlgeriaAngolaAntigua and BarbudaArab WorldArgentinaArmeniaArubaAustraliaAustriaAzerbaijanBahamas, TheBahrainBangladeshBarbadosBelarusBelgiumBelizeBeninBermudaBhutanBoliviaBosnia and HerzegovinaBotswanaBrazilBrunei DarussalamBulgariaBurkina FasoBurundiCabo VerdeCambodiaCameroonCanadaCaribbean small statesCentral African RepublicCentral Europe and the BalticsChadChileChinaColombiaComorosCongo, Dem. Rep.Congo, Rep.Costa RicaCote d'IvoireCroatiaCuracaoCyprusCzech RepublicDenmarkDjiboutiDominicaDominican RepublicEarly-demographic dividendEast Asia & PacificEast Asia & Pacific (excluding high income)East Asia & Pacific (IDA & IBRD countries)EcuadorEgypt, Arab Rep.El SalvadorEquatorial GuineaEritreaEstoniaEthiopiaEuro areaEurope & Central AsiaEurope & Central Asia (excluding high income)Europe & Central Asia (IDA & IBRD countries)European UnionFaroe IslandsFijiFinlandFragile and conflict affected situationsFranceFrench PolynesiaGabonGambia, TheGeorgiaGermanyGhanaGreeceGrenadaGuatemalaGuineaGuinea-BissauGuyanaHaitiHeavily indebted poor countries (HIPC)High incomeHondurasHong Kong SAR, ChinaHungaryIBRD onlyIcelandIDA & IBRD totalIDA onlyIDA totalIndiaIndonesiaIran, Islamic Rep.IraqIrelandIsraelItalyJamaicaJapanJordanKazakhstanKenyaKiribatiKorea, Rep.KosovoKuwaitKyrgyz RepublicLao PDRLate-demographic dividendLatin America & Caribbean Latin America & Caribbean (excluding high income)Latin America & the Caribbean (IDA & IBRD countries)LatviaLeast developed countries: UN classificationLebanonLesothoLiberiaLibyaLithuaniaLow & middle incomeLow incomeLower middle incomeLuxembourgMacao SAR, ChinaMacedonia, FYRMadagascarMalawiMalaysiaMaldivesMaliMaltaMarshall IslandsMauritaniaMauritiusMexicoMicronesia, Fed. Sts.Middle East & North AfricaMiddle East & North Africa (excluding high income)Middle East & North Africa (IDA & IBRD countries)Middle incomeMoldovaMongoliaMontenegroMoroccoMozambiqueMyanmarNamibiaNepalNetherlandsNew CaledoniaNew ZealandNicaraguaNigerNigeriaNorth AmericaNorwayOECD membersOmanOther small statesPacific island small statesPakistanPalauPanamaPapua New GuineaParaguayPeruPhilippinesPolandPortugalPost-demographic dividendPre-demographic dividendQatarRomaniaRussian FederationRwandaSamoaSao Tome and PrincipeSaudi ArabiaSenegalSerbiaSeychellesSierra LeoneSingaporeSint Maarten (Dutch part)Slovak RepublicSloveniaSmall statesSolomon IslandsSouth AfricaSouth AsiaSouth Asia (IDA & IBRD)South SudanSpainSri LankaSt. Kitts and NevisSt. LuciaSt. Vincent and the GrenadinesSub-Saharan Africa Sub-Saharan Africa (excluding high income)Sub-Saharan Africa (IDA & IBRD countries)SudanSurinameSwazilandSwedenSwitzerlandSyrian Arab RepublicTajikistanTanzaniaThailandTimor-LesteTogoTongaTrinidad and TobagoTunisiaTurkeyTuvaluUgandaUkraineUnited KingdomUnited StatesUpper middle incomeUruguayVanuatuVenezuela, RBWest Bank and GazaWorldYemen, Rep.ZambiaZimbabwe Timeline:
This timeline shows a graph from 1978 to 2016 of Philippines. No data until 1977. Number of actual observations by date: 39.
Source name:
World Development Indicators
Source organization:
International Monetary Fund, Balance of Payments Statistics Yearbook and data files.
Categories, topics:
Economy & Growth, Trade
Last updated:
apr 23, 2017
Indicators value changes by year
Minimum:
15.714
jan 1, 2006
Maximum:
66.591
jan 1, 1998
At the date of observation
Value
Absolute change
Change from previous value
jan 1, 1978
45.794
+45.794
0.0%
jan 1, 1979
44.7
-1.094
-2.39%
jan 1, 1980
39.407
-5.293
-11.84%
jan 1, 1981
39.819
+0.413
1.05%
jan 1, 1982
44.424
+4.605
11.56%
jan 1, 1983
47.175
+2.751
6.19%
jan 1, 1984
49.221
+2.046
4.34%
jan 1, 1985
60.553
+11.332
23.02%
jan 1, 1986
52.134
-8.419
-13.9%
jan 1, 1987
44.076
-8.058
-15.46%
jan 1, 1988
41.732
-2.344
-5.32%
jan 1, 1989
35.627
-6.105
-14.63%
jan 1, 1990
35.166
-0.461
-1.29%
jan 1, 1991
34.696
-0.47
-1.34%
jan 1, 1992
35.144
+0.448
1.29%
jan 1, 1993
40.425
+5.28
15.03%
jan 1, 1994
46.667
+6.242
15.44%
jan 1, 1995
62.312
+15.645
33.53%
jan 1, 1996
62.72
+0.408
0.66%
jan 1, 1997
61.47
-1.25
-1.99%
jan 1, 1998
66.591
+5.121
8.33%
jan 1, 1999
60.661
-5.93
-8.91%
jan 1, 2000
26.443
-34.218
-56.41%
jan 1, 2001
26.015
-0.428
-1.62%
jan 1, 2002
27.283
+1.268
4.87%
jan 1, 2003
23.874
-3.409
-12.5%
jan 1, 2004
24.764
+0.89
3.73%
jan 1, 2005
20.784
-3.98
-16.07%
jan 1, 2006
15.714
-5.071
-24.4%
jan 1, 2007
17.277
+1.564
9.95%
jan 1, 2008
20.565
+3.288
19.03%
jan 1, 2009
24.881
+4.316
20.99%
jan 1, 2010
21.009
-3.872
-15.56%
jan 1, 2011
17.488
-3.521
-16.76%
jan 1, 2012
18.515
+1.027
5.87%
jan 1, 2013
20.806
+2.291
12.38%
jan 1, 2014
24.277
+3.47
16.68%
jan 1, 2015
25.202
+0.926
3.81%
jan 1, 2016
29.821
+4.619
18.33%
Ranking of countries by current statistics by years


Comments: