29
/
en
AIzaSyAYiBZKx7MnpbEhh9jyipgxe19OcubqV5w
April 1, 2024
230809
Rwanda
RWA
true
2
1
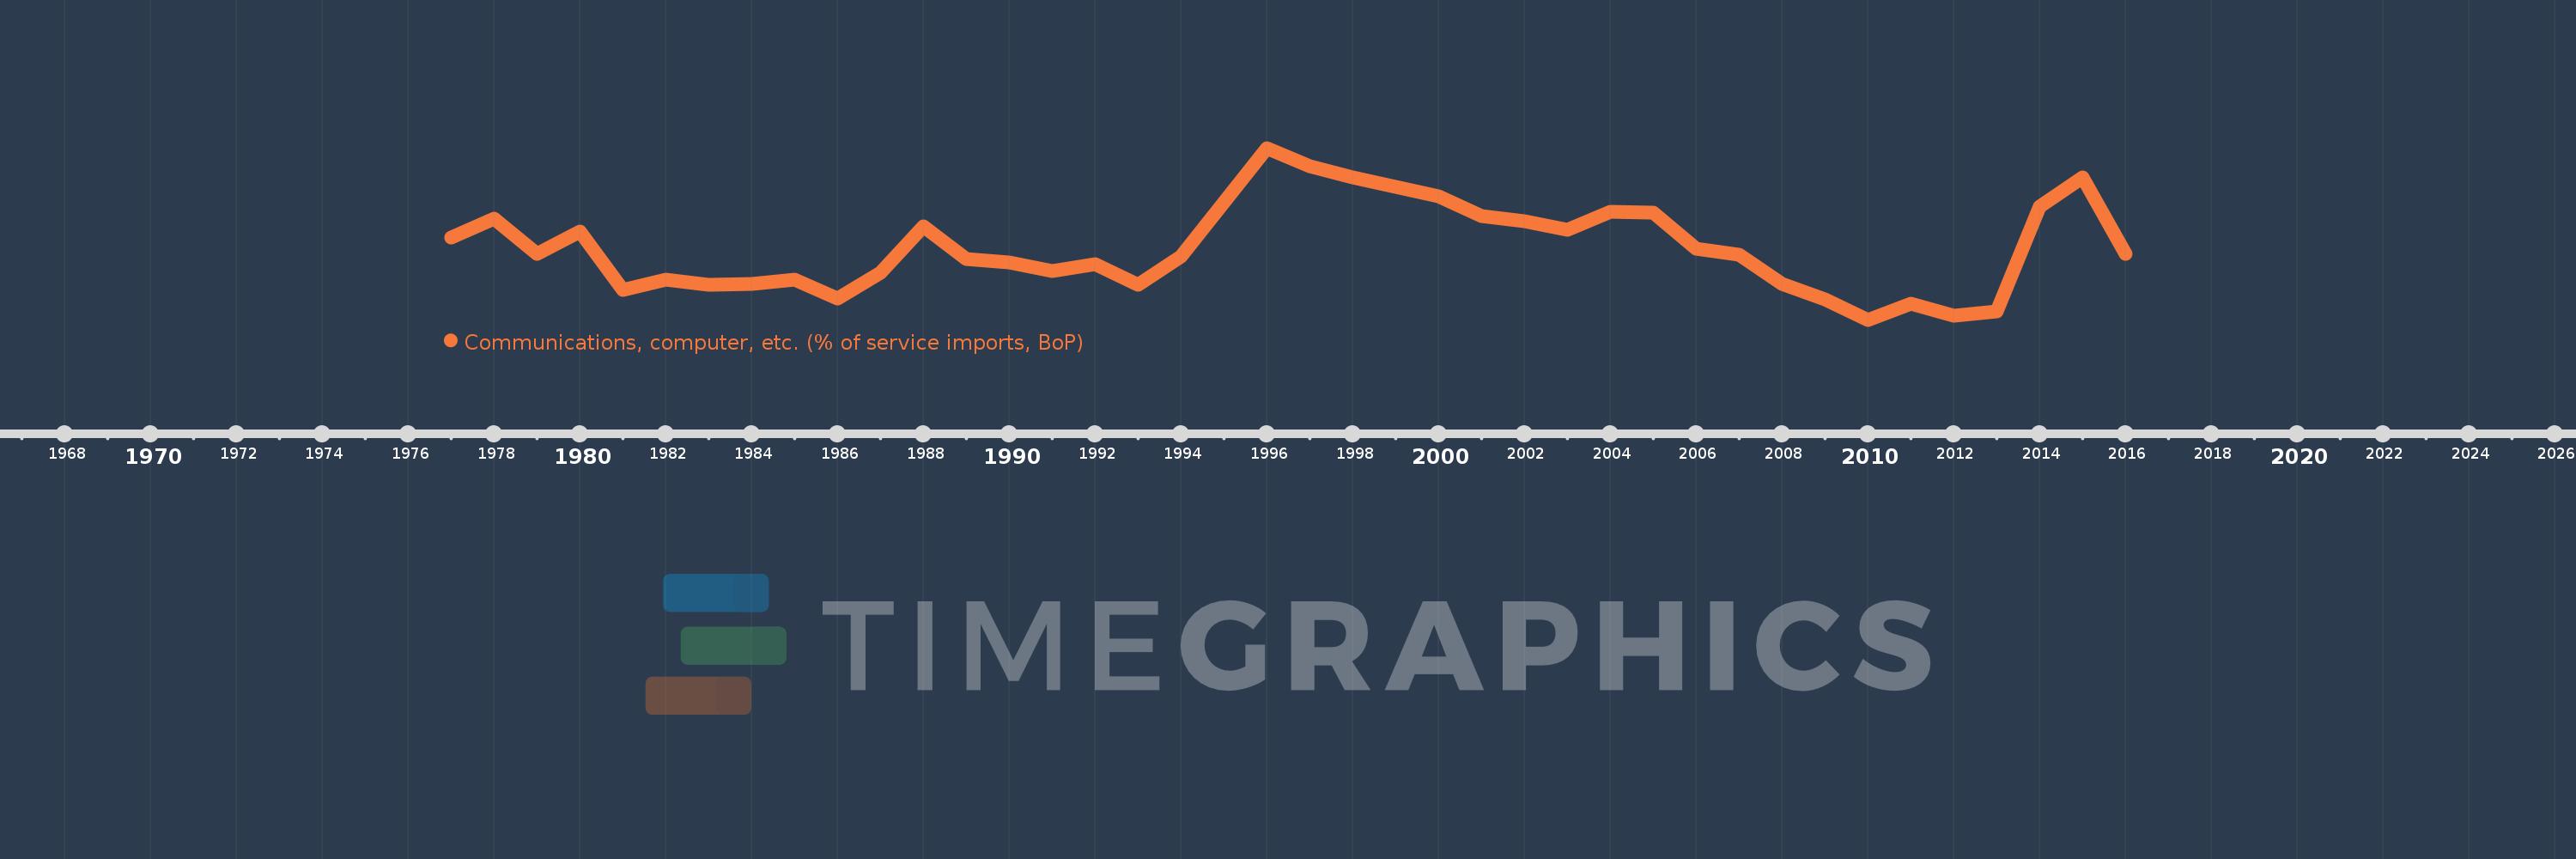
Communications, computer, etc. (% of service imports, BoP)
2016,2015,2014,2013,2012,2011,2010,2009,2008,2007,2006,2005,2004,2003,2002,2001,2000,1999,1998,1997,1996,1994,1993,1992,1991,1990,1989,1988,1987,1986,1985,1984,1983,1982,1981,1980,1979,1978,1977
This statistics in other country:
AfghanistanAlbaniaAlgeriaAngolaAntigua and BarbudaArab WorldArgentinaArmeniaArubaAustraliaAustriaAzerbaijanBahamas, TheBahrainBangladeshBarbadosBelarusBelgiumBelizeBeninBermudaBhutanBoliviaBosnia and HerzegovinaBotswanaBrazilBrunei DarussalamBulgariaBurkina FasoBurundiCabo VerdeCambodiaCameroonCanadaCaribbean small statesCentral African RepublicCentral Europe and the BalticsChadChileChinaColombiaComorosCongo, Dem. Rep.Congo, Rep.Costa RicaCote d'IvoireCroatiaCuracaoCyprusCzech RepublicDenmarkDjiboutiDominicaDominican RepublicEarly-demographic dividendEast Asia & PacificEast Asia & Pacific (excluding high income)East Asia & Pacific (IDA & IBRD countries)EcuadorEgypt, Arab Rep.El SalvadorEquatorial GuineaEritreaEstoniaEthiopiaEuro areaEurope & Central AsiaEurope & Central Asia (excluding high income)Europe & Central Asia (IDA & IBRD countries)European UnionFaroe IslandsFijiFinlandFragile and conflict affected situationsFranceFrench PolynesiaGabonGambia, TheGeorgiaGermanyGhanaGreeceGrenadaGuatemalaGuineaGuinea-BissauGuyanaHaitiHeavily indebted poor countries (HIPC)High incomeHondurasHong Kong SAR, ChinaHungaryIBRD onlyIcelandIDA & IBRD totalIDA onlyIDA totalIndiaIndonesiaIran, Islamic Rep.IraqIrelandIsraelItalyJamaicaJapanJordanKazakhstanKenyaKiribatiKorea, Rep.KosovoKuwaitKyrgyz RepublicLao PDRLate-demographic dividendLatin America & Caribbean Latin America & Caribbean (excluding high income)Latin America & the Caribbean (IDA & IBRD countries)LatviaLeast developed countries: UN classificationLebanonLesothoLiberiaLibyaLithuaniaLow & middle incomeLow incomeLower middle incomeLuxembourgMacao SAR, ChinaMacedonia, FYRMadagascarMalawiMalaysiaMaldivesMaliMaltaMarshall IslandsMauritaniaMauritiusMexicoMicronesia, Fed. Sts.Middle East & North AfricaMiddle East & North Africa (excluding high income)Middle East & North Africa (IDA & IBRD countries)Middle incomeMoldovaMongoliaMontenegroMoroccoMozambiqueMyanmarNamibiaNepalNetherlandsNew CaledoniaNew ZealandNicaraguaNigerNigeriaNorth AmericaNorwayOECD membersOmanOther small statesPacific island small statesPakistanPalauPanamaPapua New GuineaParaguayPeruPhilippinesPolandPortugalPost-demographic dividendPre-demographic dividendQatarRomaniaRussian FederationRwandaSamoaSao Tome and PrincipeSaudi ArabiaSenegalSerbiaSeychellesSierra LeoneSingaporeSint Maarten (Dutch part)Slovak RepublicSloveniaSmall statesSolomon IslandsSouth AfricaSouth AsiaSouth Asia (IDA & IBRD)South SudanSpainSri LankaSt. Kitts and NevisSt. LuciaSt. Vincent and the GrenadinesSub-Saharan Africa Sub-Saharan Africa (excluding high income)Sub-Saharan Africa (IDA & IBRD countries)SudanSurinameSwazilandSwedenSwitzerlandSyrian Arab RepublicTajikistanTanzaniaThailandTimor-LesteTogoTongaTrinidad and TobagoTunisiaTurkeyTuvaluUgandaUkraineUnited KingdomUnited StatesUpper middle incomeUruguayVanuatuVenezuela, RBWest Bank and GazaWorldYemen, Rep.ZambiaZimbabwe Timeline:
This timeline shows a graph from 1977 to 2016 of Rwanda. No data until 1976. Number of actual observations by date: 39.
Source name:
World Development Indicators
Source organization:
International Monetary Fund, Balance of Payments Statistics Yearbook and data files.
Categories, topics:
Economy & Growth, Trade
Last updated:
apr 23, 2017
Indicators value changes by year
Minimum:
19.037
jan 1, 2010
Maximum:
66.471
jan 1, 1996
At the date of observation
Value
Absolute change
Change from previous value
jan 1, 1977
41.641
+41.641
0.0%
jan 1, 1978
47.016
+5.374
12.91%
jan 1, 1979
37.243
-9.772
-20.79%
jan 1, 1980
43.433
+6.189
16.62%
jan 1, 1981
27.277
-16.155
-37.2%
jan 1, 1982
30.1
+2.823
10.35%
jan 1, 1983
28.669
-1.431
-4.75%
jan 1, 1984
28.846
+0.177
0.62%
jan 1, 1985
30.189
+1.343
4.65%
jan 1, 1986
24.963
-5.225
-17.31%
jan 1, 1987
32.019
+7.055
28.26%
jan 1, 1988
44.72
+12.702
39.67%
jan 1, 1989
35.693
-9.027
-20.19%
jan 1, 1990
34.964
-0.73
-2.04%
jan 1, 1991
32.37
-2.594
-7.42%
jan 1, 1992
34.286
+1.916
5.92%
jan 1, 1993
28.707
-5.579
-16.27%
jan 1, 1994
36.601
+7.894
27.5%
jan 1, 1996
66.471
+29.87
81.61%
jan 1, 1997
61.489
-4.982
-7.5%
jan 1, 1998
58.315
-3.173
-5.16%
jan 1, 1999
55.677
-2.638
-4.52%
jan 1, 2000
53.007
-2.67
-4.8%
jan 1, 2001
47.769
-5.239
-9.88%
jan 1, 2002
46.274
-1.495
-3.13%
jan 1, 2003
43.943
-2.331
-5.04%
jan 1, 2004
48.775
+4.832
11.0%
jan 1, 2005
48.576
-0.199
-0.41%
jan 1, 2006
38.672
-9.904
-20.39%
jan 1, 2007
36.875
-1.797
-4.65%
jan 1, 2008
28.878
-7.997
-21.69%
jan 1, 2009
24.579
-4.299
-14.89%
jan 1, 2010
19.037
-5.542
-22.55%
jan 1, 2011
23.537
+4.5
23.64%
jan 1, 2012
20.184
-3.353
-14.24%
jan 1, 2013
21.339
+1.155
5.72%
jan 1, 2014
50.371
+29.032
136.05%
jan 1, 2015
58.253
+7.882
15.65%
jan 1, 2016
37.287
-20.966
-35.99%
Ranking of countries by current statistics by years


Comments: