29
/
en
AIzaSyAYiBZKx7MnpbEhh9jyipgxe19OcubqV5w
April 1, 2024
167243
Kenya
KEN
true
2
1
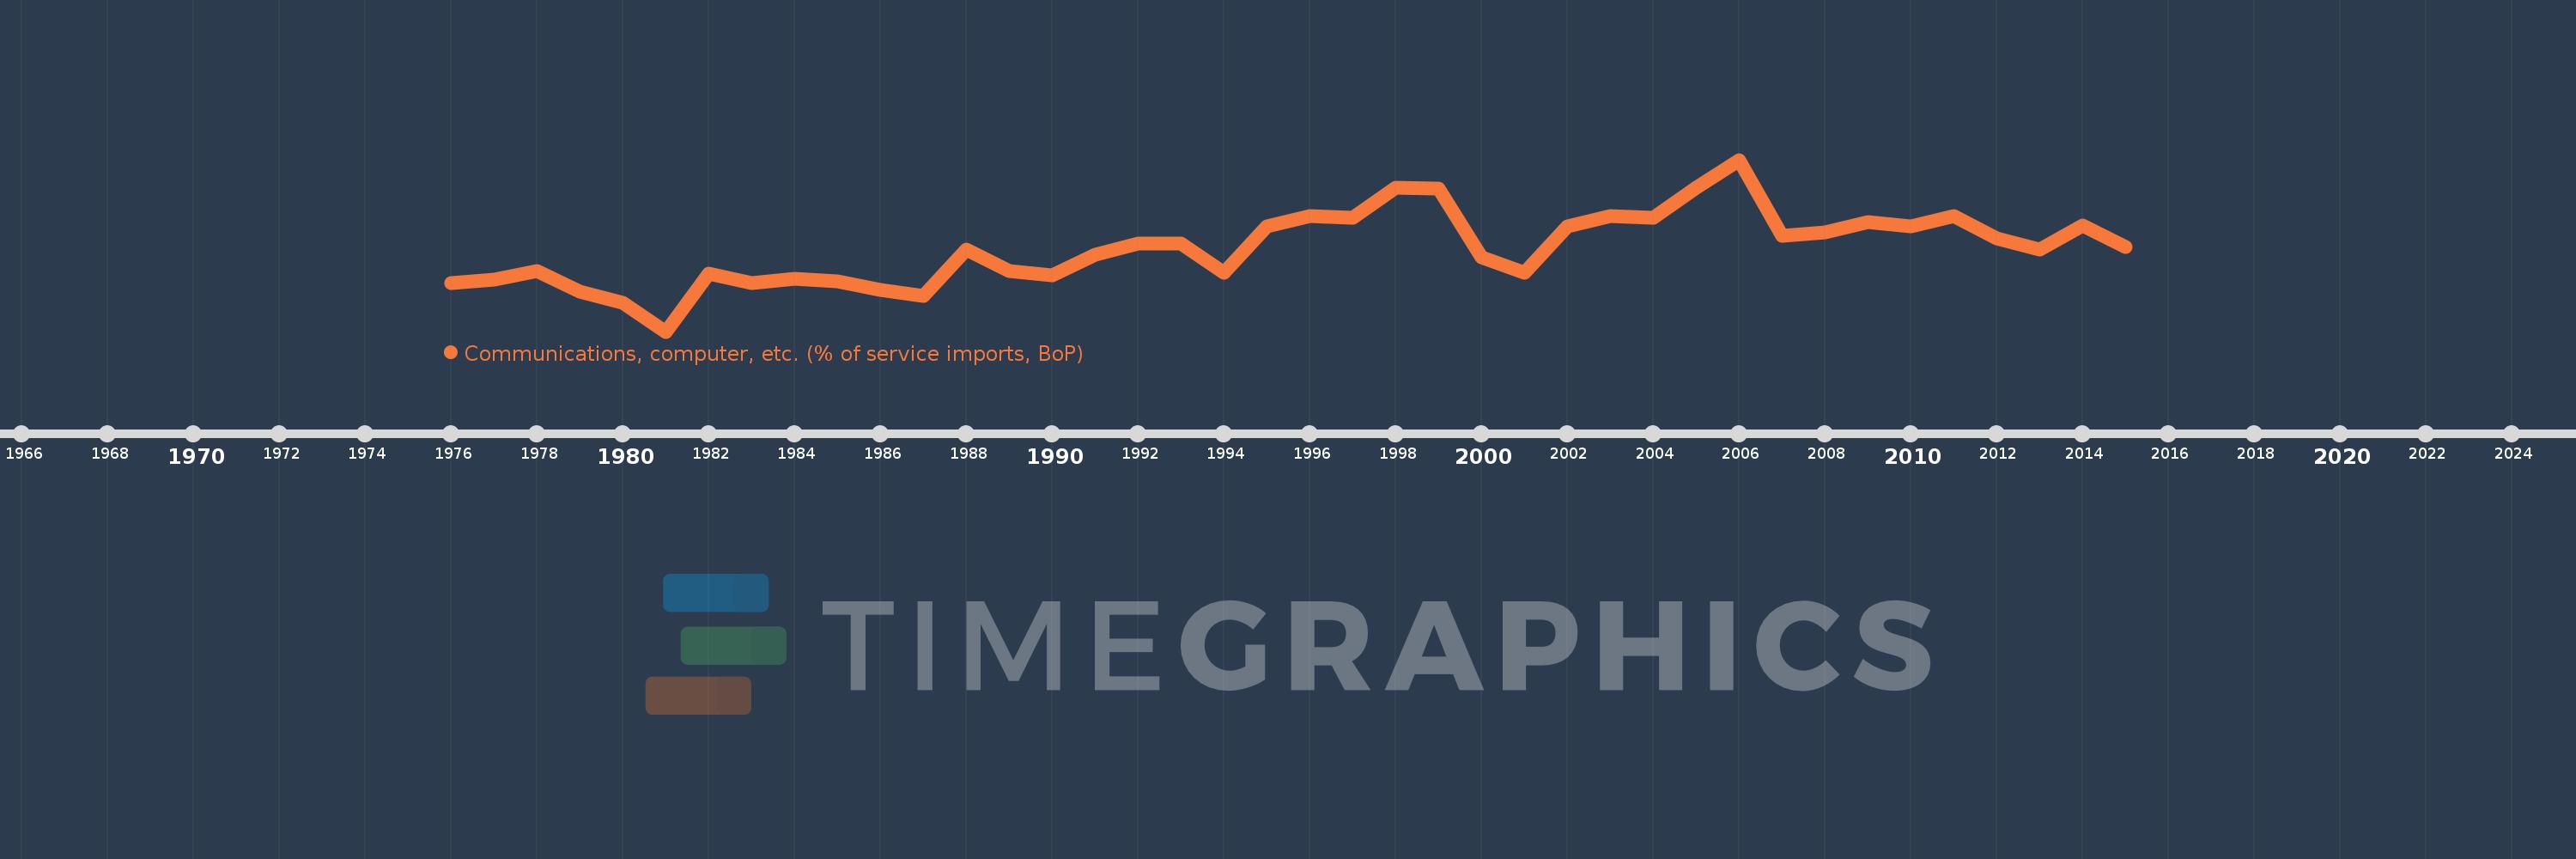
Communications, computer, etc. (% of service imports, BoP)
2015,2014,2013,2012,2011,2010,2009,2008,2007,2006,2005,2004,2003,2002,2001,2000,1999,1998,1997,1996,1995,1994,1993,1992,1991,1990,1989,1988,1987,1986,1985,1984,1983,1982,1981,1980,1979,1978,1977,1976
This statistics in other country:
AfghanistanAlbaniaAlgeriaAngolaAntigua and BarbudaArab WorldArgentinaArmeniaArubaAustraliaAustriaAzerbaijanBahamas, TheBahrainBangladeshBarbadosBelarusBelgiumBelizeBeninBermudaBhutanBoliviaBosnia and HerzegovinaBotswanaBrazilBrunei DarussalamBulgariaBurkina FasoBurundiCabo VerdeCambodiaCameroonCanadaCaribbean small statesCentral African RepublicCentral Europe and the BalticsChadChileChinaColombiaComorosCongo, Dem. Rep.Congo, Rep.Costa RicaCote d'IvoireCroatiaCuracaoCyprusCzech RepublicDenmarkDjiboutiDominicaDominican RepublicEarly-demographic dividendEast Asia & PacificEast Asia & Pacific (excluding high income)East Asia & Pacific (IDA & IBRD countries)EcuadorEgypt, Arab Rep.El SalvadorEquatorial GuineaEritreaEstoniaEthiopiaEuro areaEurope & Central AsiaEurope & Central Asia (excluding high income)Europe & Central Asia (IDA & IBRD countries)European UnionFaroe IslandsFijiFinlandFragile and conflict affected situationsFranceFrench PolynesiaGabonGambia, TheGeorgiaGermanyGhanaGreeceGrenadaGuatemalaGuineaGuinea-BissauGuyanaHaitiHeavily indebted poor countries (HIPC)High incomeHondurasHong Kong SAR, ChinaHungaryIBRD onlyIcelandIDA & IBRD totalIDA onlyIDA totalIndiaIndonesiaIran, Islamic Rep.IraqIrelandIsraelItalyJamaicaJapanJordanKazakhstanKenyaKiribatiKorea, Rep.KosovoKuwaitKyrgyz RepublicLao PDRLate-demographic dividendLatin America & Caribbean Latin America & Caribbean (excluding high income)Latin America & the Caribbean (IDA & IBRD countries)LatviaLeast developed countries: UN classificationLebanonLesothoLiberiaLibyaLithuaniaLow & middle incomeLow incomeLower middle incomeLuxembourgMacao SAR, ChinaMacedonia, FYRMadagascarMalawiMalaysiaMaldivesMaliMaltaMarshall IslandsMauritaniaMauritiusMexicoMicronesia, Fed. Sts.Middle East & North AfricaMiddle East & North Africa (excluding high income)Middle East & North Africa (IDA & IBRD countries)Middle incomeMoldovaMongoliaMontenegroMoroccoMozambiqueMyanmarNamibiaNepalNetherlandsNew CaledoniaNew ZealandNicaraguaNigerNigeriaNorth AmericaNorwayOECD membersOmanOther small statesPacific island small statesPakistanPalauPanamaPapua New GuineaParaguayPeruPhilippinesPolandPortugalPost-demographic dividendPre-demographic dividendQatarRomaniaRussian FederationRwandaSamoaSao Tome and PrincipeSaudi ArabiaSenegalSerbiaSeychellesSierra LeoneSingaporeSint Maarten (Dutch part)Slovak RepublicSloveniaSmall statesSolomon IslandsSouth AfricaSouth AsiaSouth Asia (IDA & IBRD)South SudanSpainSri LankaSt. Kitts and NevisSt. LuciaSt. Vincent and the GrenadinesSub-Saharan Africa Sub-Saharan Africa (excluding high income)Sub-Saharan Africa (IDA & IBRD countries)SudanSurinameSwazilandSwedenSwitzerlandSyrian Arab RepublicTajikistanTanzaniaThailandTimor-LesteTogoTongaTrinidad and TobagoTunisiaTurkeyTuvaluUgandaUkraineUnited KingdomUnited StatesUpper middle incomeUruguayVanuatuVenezuela, RBWest Bank and GazaWorldYemen, Rep.ZambiaZimbabwe Timeline:
This timeline shows a graph from 1976 to 2015 of Kenya. No data until 1975. Number of actual observations by date: 40.
Source name:
World Development Indicators
Source organization:
International Monetary Fund, Balance of Payments Statistics Yearbook and data files.
Categories, topics:
Economy & Growth, Trade
Last updated:
apr 23, 2017
Indicators value changes by year
Minimum:
18.001
jan 1, 1981
Maximum:
45.551
jan 1, 2006
At the date of observation
Value
Absolute change
Change from previous value
jan 1, 1976
25.816
+25.816
0.0%
jan 1, 1977
26.369
+0.553
2.14%
jan 1, 1978
27.711
+1.342
5.09%
jan 1, 1979
24.404
-3.307
-11.94%
jan 1, 1980
22.664
-1.739
-7.13%
jan 1, 1981
18.001
-4.663
-20.58%
jan 1, 1982
27.357
+9.356
51.97%
jan 1, 1983
25.741
-1.615
-5.91%
jan 1, 1984
26.419
+0.678
2.63%
jan 1, 1985
26.003
-0.416
-1.57%
jan 1, 1986
24.712
-1.291
-4.96%
jan 1, 1987
23.749
-0.963
-3.9%
jan 1, 1988
31.222
+7.473
31.46%
jan 1, 1989
27.684
-3.538
-11.33%
jan 1, 1990
26.983
-0.702
-2.54%
jan 1, 1991
30.387
+3.405
12.62%
jan 1, 1992
32.13
+1.743
5.73%
jan 1, 1993
32.156
+0.026
0.08%
jan 1, 1994
27.439
-4.717
-14.67%
jan 1, 1995
34.849
+7.41
27.01%
jan 1, 1996
36.566
+1.717
4.93%
jan 1, 1997
36.29
-0.276
-0.75%
jan 1, 1998
41.058
+4.768
13.14%
jan 1, 1999
40.923
-0.135
-0.33%
jan 1, 2000
29.984
-10.94
-26.73%
jan 1, 2001
27.439
-2.545
-8.49%
jan 1, 2002
34.849
+7.41
27.01%
jan 1, 2003
36.566
+1.717
4.93%
jan 1, 2004
36.29
-0.276
-0.75%
jan 1, 2005
41.039
+4.749
13.09%
jan 1, 2006
45.551
+4.512
10.99%
jan 1, 2007
33.404
-12.148
-26.67%
jan 1, 2008
33.935
+0.531
1.59%
jan 1, 2009
35.518
+1.583
4.66%
jan 1, 2010
34.943
-0.575
-1.62%
jan 1, 2011
36.49
+1.547
4.43%
jan 1, 2012
33.001
-3.489
-9.56%
jan 1, 2013
31.089
-1.912
-5.79%
jan 1, 2014
35.033
+3.944
12.69%
jan 1, 2015
31.555
-3.479
-9.93%
Ranking of countries by current statistics by years


Comments: