29
/
en
AIzaSyAYiBZKx7MnpbEhh9jyipgxe19OcubqV5w
April 1, 2024
198883
Mongolia
MNG
true
2
1
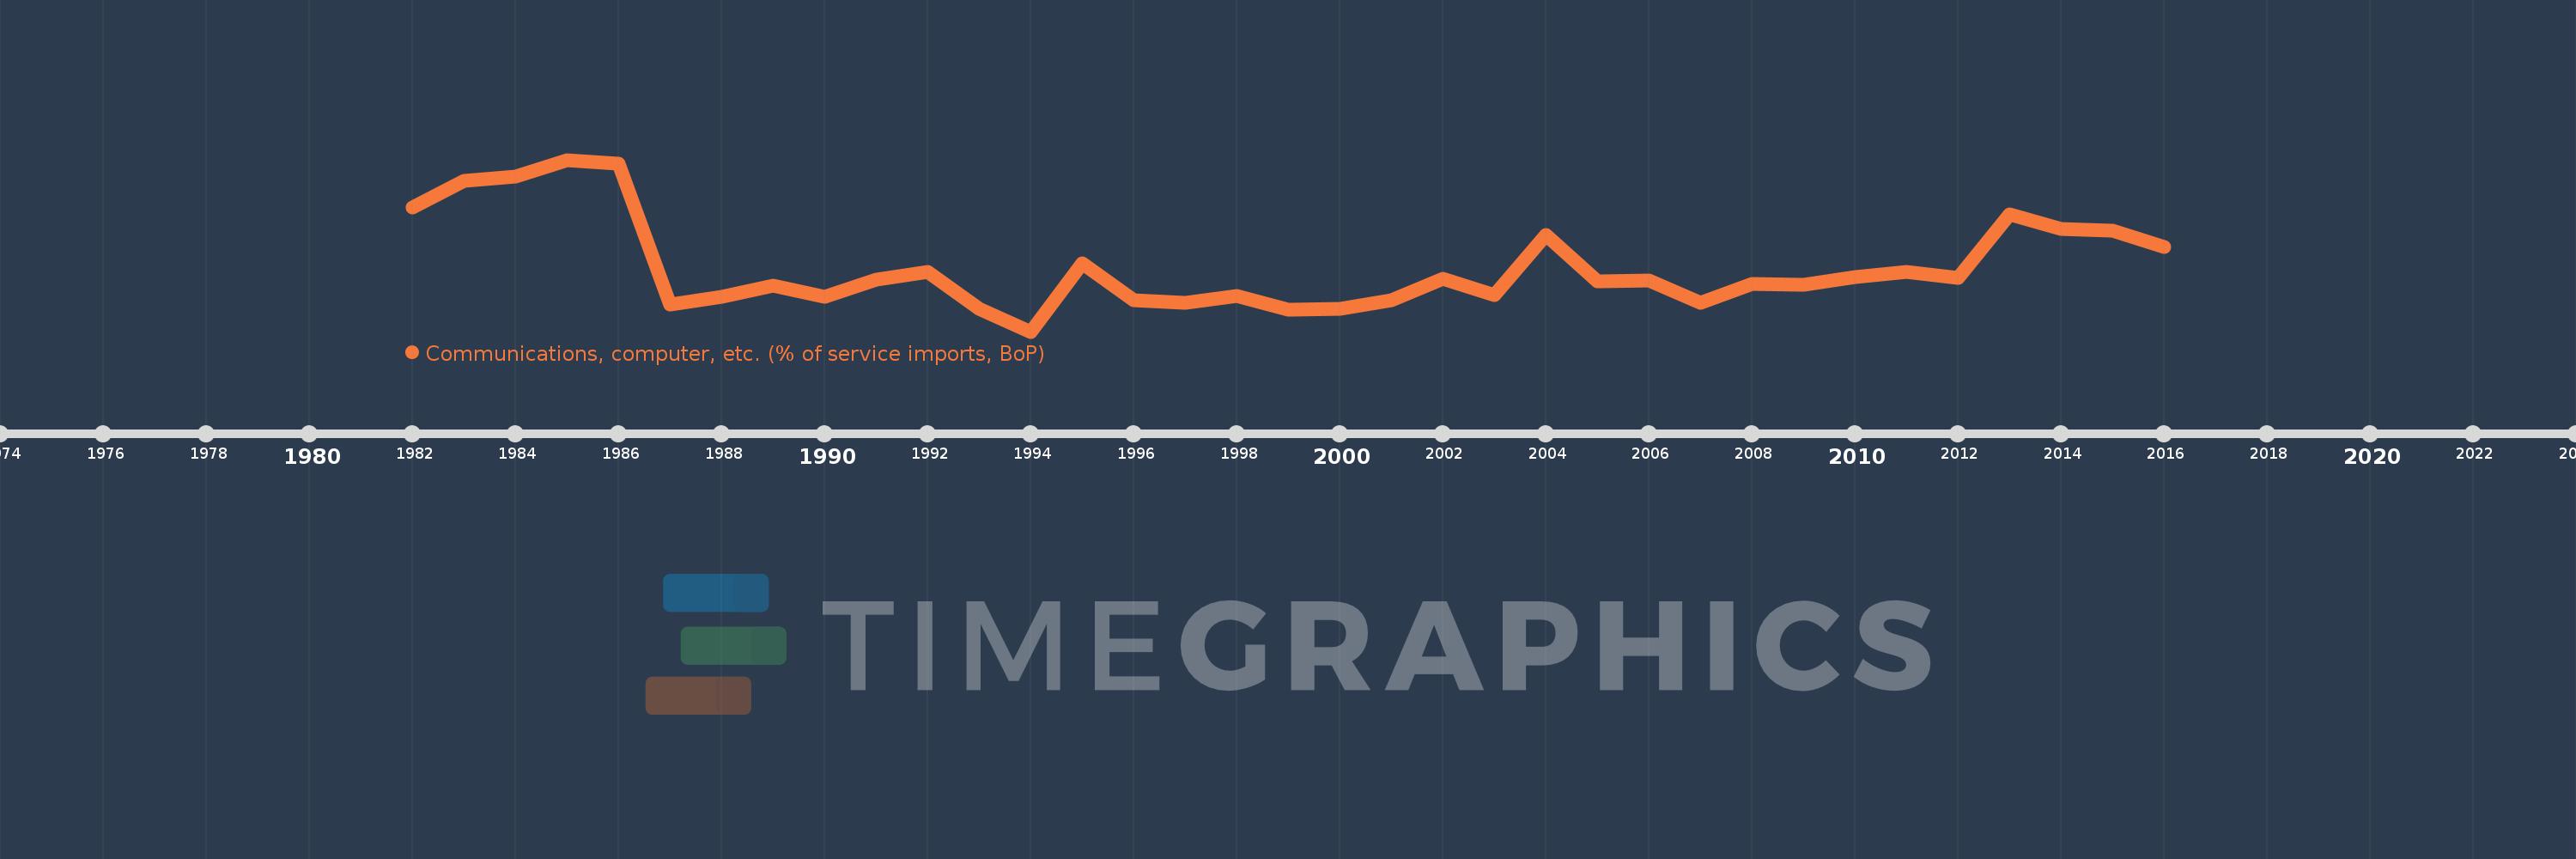
Communications, computer, etc. (% of service imports, BoP)
2016,2015,2014,2013,2012,2011,2010,2009,2008,2007,2006,2005,2004,2003,2002,2001,2000,1999,1998,1997,1996,1995,1994,1993,1992,1991,1990,1989,1988,1987,1986,1985,1984,1983,1982
This statistics in other country:
AfghanistanAlbaniaAlgeriaAngolaAntigua and BarbudaArab WorldArgentinaArmeniaArubaAustraliaAustriaAzerbaijanBahamas, TheBahrainBangladeshBarbadosBelarusBelgiumBelizeBeninBermudaBhutanBoliviaBosnia and HerzegovinaBotswanaBrazilBrunei DarussalamBulgariaBurkina FasoBurundiCabo VerdeCambodiaCameroonCanadaCaribbean small statesCentral African RepublicCentral Europe and the BalticsChadChileChinaColombiaComorosCongo, Dem. Rep.Congo, Rep.Costa RicaCote d'IvoireCroatiaCuracaoCyprusCzech RepublicDenmarkDjiboutiDominicaDominican RepublicEarly-demographic dividendEast Asia & PacificEast Asia & Pacific (excluding high income)East Asia & Pacific (IDA & IBRD countries)EcuadorEgypt, Arab Rep.El SalvadorEquatorial GuineaEritreaEstoniaEthiopiaEuro areaEurope & Central AsiaEurope & Central Asia (excluding high income)Europe & Central Asia (IDA & IBRD countries)European UnionFaroe IslandsFijiFinlandFragile and conflict affected situationsFranceFrench PolynesiaGabonGambia, TheGeorgiaGermanyGhanaGreeceGrenadaGuatemalaGuineaGuinea-BissauGuyanaHaitiHeavily indebted poor countries (HIPC)High incomeHondurasHong Kong SAR, ChinaHungaryIBRD onlyIcelandIDA & IBRD totalIDA onlyIDA totalIndiaIndonesiaIran, Islamic Rep.IraqIrelandIsraelItalyJamaicaJapanJordanKazakhstanKenyaKiribatiKorea, Rep.KosovoKuwaitKyrgyz RepublicLao PDRLate-demographic dividendLatin America & Caribbean Latin America & Caribbean (excluding high income)Latin America & the Caribbean (IDA & IBRD countries)LatviaLeast developed countries: UN classificationLebanonLesothoLiberiaLibyaLithuaniaLow & middle incomeLow incomeLower middle incomeLuxembourgMacao SAR, ChinaMacedonia, FYRMadagascarMalawiMalaysiaMaldivesMaliMaltaMarshall IslandsMauritaniaMauritiusMexicoMicronesia, Fed. Sts.Middle East & North AfricaMiddle East & North Africa (excluding high income)Middle East & North Africa (IDA & IBRD countries)Middle incomeMoldovaMongoliaMontenegroMoroccoMozambiqueMyanmarNamibiaNepalNetherlandsNew CaledoniaNew ZealandNicaraguaNigerNigeriaNorth AmericaNorwayOECD membersOmanOther small statesPacific island small statesPakistanPalauPanamaPapua New GuineaParaguayPeruPhilippinesPolandPortugalPost-demographic dividendPre-demographic dividendQatarRomaniaRussian FederationRwandaSamoaSao Tome and PrincipeSaudi ArabiaSenegalSerbiaSeychellesSierra LeoneSingaporeSint Maarten (Dutch part)Slovak RepublicSloveniaSmall statesSolomon IslandsSouth AfricaSouth AsiaSouth Asia (IDA & IBRD)South SudanSpainSri LankaSt. Kitts and NevisSt. LuciaSt. Vincent and the GrenadinesSub-Saharan Africa Sub-Saharan Africa (excluding high income)Sub-Saharan Africa (IDA & IBRD countries)SudanSurinameSwazilandSwedenSwitzerlandSyrian Arab RepublicTajikistanTanzaniaThailandTimor-LesteTogoTongaTrinidad and TobagoTunisiaTurkeyTuvaluUgandaUkraineUnited KingdomUnited StatesUpper middle incomeUruguayVanuatuVenezuela, RBWest Bank and GazaWorldYemen, Rep.ZambiaZimbabwe Timeline:
This timeline shows a graph from 1982 to 2016 of Mongolia. No data until 1981. Number of actual observations by date: 35.
Source name:
World Development Indicators
Source organization:
International Monetary Fund, Balance of Payments Statistics Yearbook and data files.
Categories, topics:
Economy & Growth, Trade
Last updated:
apr 23, 2017
Indicators value changes by year
Maximum:
69.458
jan 1, 1985
At the date of observation
Value
Absolute change
Change from previous value
jan 1, 1982
51.282
+51.282
0.0%
jan 1, 1983
61.364
+10.082
19.66%
jan 1, 1984
62.998
+1.634
2.66%
jan 1, 1985
69.458
+6.46
10.26%
jan 1, 1986
68.01
-1.448
-2.08%
jan 1, 1987
14.181
-53.829
-79.15%
jan 1, 1988
16.986
+2.804
19.77%
jan 1, 1989
21.335
+4.349
25.6%
jan 1, 1990
17.089
-4.245
-19.9%
jan 1, 1991
23.521
+6.432
37.63%
jan 1, 1992
26.621
+3.1
13.18%
jan 1, 1993
12.396
-14.225
-53.44%
jan 1, 1994
3.662
-8.734
-70.46%
jan 1, 1995
29.781
+26.119
713.2%
jan 1, 1996
15.828
-13.953
-46.85%
jan 1, 1997
14.539
-1.289
-8.14%
jan 1, 1998
17.412
+2.873
19.76%
jan 1, 1999
12.193
-5.219
-29.97%
jan 1, 2000
12.469
+0.276
2.26%
jan 1, 2001
15.767
+3.298
26.45%
jan 1, 2002
23.845
+8.078
51.24%
jan 1, 2003
17.651
-6.195
-25.98%
jan 1, 2004
40.697
+23.047
130.57%
jan 1, 2005
22.956
-17.741
-43.59%
jan 1, 2006
23.326
+0.37
1.61%
jan 1, 2007
14.792
-8.534
-36.59%
jan 1, 2008
21.987
+7.195
48.64%
jan 1, 2009
21.585
-0.402
-1.83%
jan 1, 2010
24.679
+3.094
14.33%
jan 1, 2011
26.572
+1.893
7.67%
jan 1, 2012
24.293
-2.28
-8.58%
jan 1, 2013
48.412
+24.119
99.28%
jan 1, 2014
43.135
-5.277
-10.9%
jan 1, 2015
42.369
-0.766
-1.78%
jan 1, 2016
36.09
-6.279
-14.82%
Ranking of countries by current statistics by years


Comments: