29
/
en
AIzaSyAYiBZKx7MnpbEhh9jyipgxe19OcubqV5w
April 1, 2024
194000
Mauritius
MUS
true
2
1
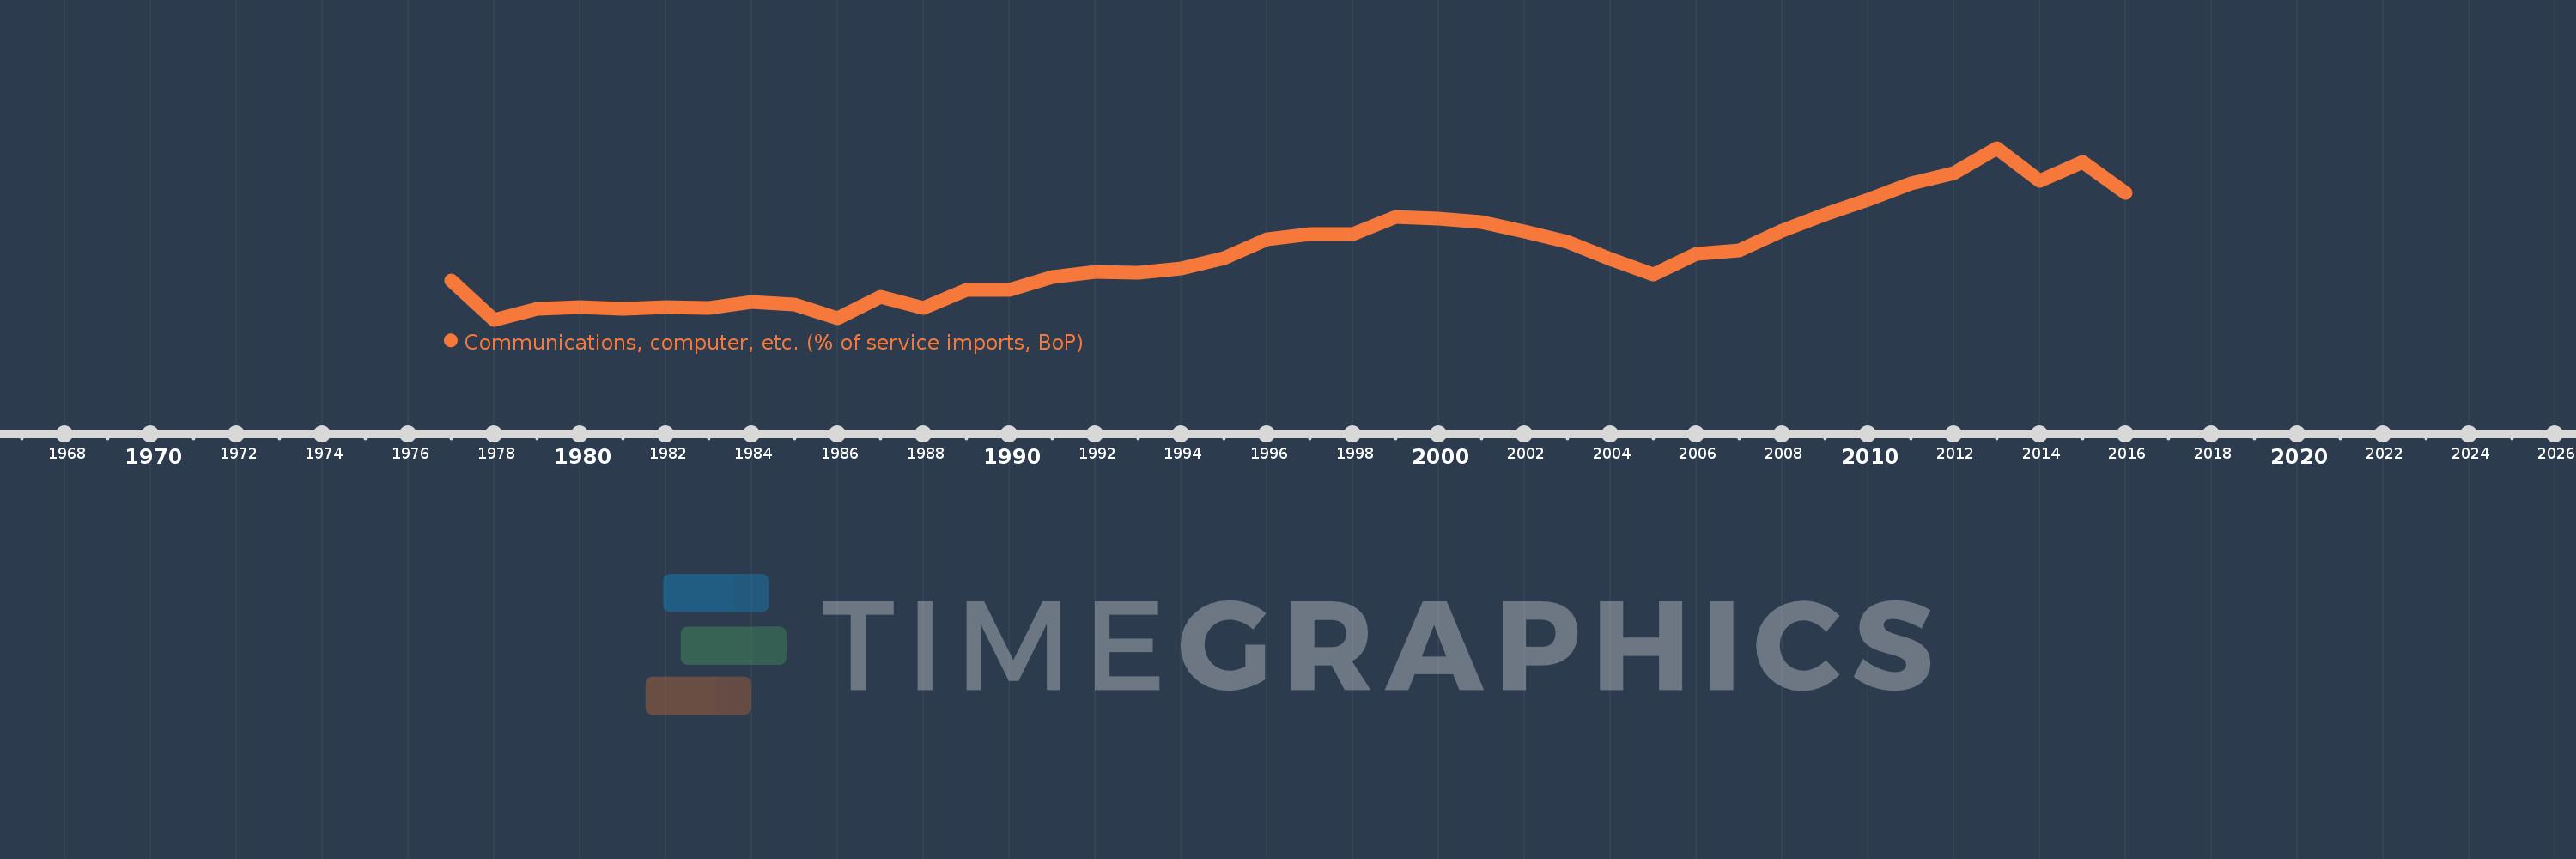
Communications, computer, etc. (% of service imports, BoP)
2016,2015,2014,2013,2012,2011,2010,2009,2008,2007,2006,2005,2004,2003,2002,2001,2000,1999,1998,1997,1996,1995,1994,1993,1992,1991,1990,1989,1988,1987,1986,1985,1984,1983,1982,1981,1980,1979,1978,1977
This statistics in other country:
AfghanistanAlbaniaAlgeriaAngolaAntigua and BarbudaArab WorldArgentinaArmeniaArubaAustraliaAustriaAzerbaijanBahamas, TheBahrainBangladeshBarbadosBelarusBelgiumBelizeBeninBermudaBhutanBoliviaBosnia and HerzegovinaBotswanaBrazilBrunei DarussalamBulgariaBurkina FasoBurundiCabo VerdeCambodiaCameroonCanadaCaribbean small statesCentral African RepublicCentral Europe and the BalticsChadChileChinaColombiaComorosCongo, Dem. Rep.Congo, Rep.Costa RicaCote d'IvoireCroatiaCuracaoCyprusCzech RepublicDenmarkDjiboutiDominicaDominican RepublicEarly-demographic dividendEast Asia & PacificEast Asia & Pacific (excluding high income)East Asia & Pacific (IDA & IBRD countries)EcuadorEgypt, Arab Rep.El SalvadorEquatorial GuineaEritreaEstoniaEthiopiaEuro areaEurope & Central AsiaEurope & Central Asia (excluding high income)Europe & Central Asia (IDA & IBRD countries)European UnionFaroe IslandsFijiFinlandFragile and conflict affected situationsFranceFrench PolynesiaGabonGambia, TheGeorgiaGermanyGhanaGreeceGrenadaGuatemalaGuineaGuinea-BissauGuyanaHaitiHeavily indebted poor countries (HIPC)High incomeHondurasHong Kong SAR, ChinaHungaryIBRD onlyIcelandIDA & IBRD totalIDA onlyIDA totalIndiaIndonesiaIran, Islamic Rep.IraqIrelandIsraelItalyJamaicaJapanJordanKazakhstanKenyaKiribatiKorea, Rep.KosovoKuwaitKyrgyz RepublicLao PDRLate-demographic dividendLatin America & Caribbean Latin America & Caribbean (excluding high income)Latin America & the Caribbean (IDA & IBRD countries)LatviaLeast developed countries: UN classificationLebanonLesothoLiberiaLibyaLithuaniaLow & middle incomeLow incomeLower middle incomeLuxembourgMacao SAR, ChinaMacedonia, FYRMadagascarMalawiMalaysiaMaldivesMaliMaltaMarshall IslandsMauritaniaMauritiusMexicoMicronesia, Fed. Sts.Middle East & North AfricaMiddle East & North Africa (excluding high income)Middle East & North Africa (IDA & IBRD countries)Middle incomeMoldovaMongoliaMontenegroMoroccoMozambiqueMyanmarNamibiaNepalNetherlandsNew CaledoniaNew ZealandNicaraguaNigerNigeriaNorth AmericaNorwayOECD membersOmanOther small statesPacific island small statesPakistanPalauPanamaPapua New GuineaParaguayPeruPhilippinesPolandPortugalPost-demographic dividendPre-demographic dividendQatarRomaniaRussian FederationRwandaSamoaSao Tome and PrincipeSaudi ArabiaSenegalSerbiaSeychellesSierra LeoneSingaporeSint Maarten (Dutch part)Slovak RepublicSloveniaSmall statesSolomon IslandsSouth AfricaSouth AsiaSouth Asia (IDA & IBRD)South SudanSpainSri LankaSt. Kitts and NevisSt. LuciaSt. Vincent and the GrenadinesSub-Saharan Africa Sub-Saharan Africa (excluding high income)Sub-Saharan Africa (IDA & IBRD countries)SudanSurinameSwazilandSwedenSwitzerlandSyrian Arab RepublicTajikistanTanzaniaThailandTimor-LesteTogoTongaTrinidad and TobagoTunisiaTurkeyTuvaluUgandaUkraineUnited KingdomUnited StatesUpper middle incomeUruguayVanuatuVenezuela, RBWest Bank and GazaWorldYemen, Rep.ZambiaZimbabwe Timeline:
This timeline shows a graph from 1977 to 2016 of Mauritius. No data until 1976. Number of actual observations by date: 40.
Source name:
World Development Indicators
Source organization:
International Monetary Fund, Balance of Payments Statistics Yearbook and data files.
Categories, topics:
Economy & Growth, Trade
Last updated:
apr 23, 2017
Indicators value changes by year
Minimum:
12.673
jan 1, 1978
Maximum:
52.611
jan 1, 2013
At the date of observation
Value
Absolute change
Change from previous value
jan 1, 1977
21.798
+21.798
0.0%
jan 1, 1978
12.673
-9.125
-41.86%
jan 1, 1979
15.237
+2.564
20.24%
jan 1, 1980
15.674
+0.437
2.87%
jan 1, 1981
15.183
-0.49
-3.13%
jan 1, 1982
15.672
+0.488
3.22%
jan 1, 1983
15.47
-0.202
-1.29%
jan 1, 1984
16.723
+1.253
8.1%
jan 1, 1985
16.179
-0.544
-3.25%
jan 1, 1986
13.002
-3.177
-19.63%
jan 1, 1987
18.096
+5.093
39.17%
jan 1, 1988
15.373
-2.723
-15.05%
jan 1, 1989
19.578
+4.206
27.36%
jan 1, 1990
19.615
+0.036
0.19%
jan 1, 1991
22.647
+3.032
15.46%
jan 1, 1992
23.864
+1.217
5.37%
jan 1, 1993
23.525
-0.339
-1.42%
jan 1, 1994
24.568
+1.043
4.43%
jan 1, 1995
26.954
+2.386
9.71%
jan 1, 1996
31.453
+4.499
16.69%
jan 1, 1997
32.588
+1.135
3.61%
jan 1, 1998
32.54
-0.048
-0.15%
jan 1, 1999
36.547
+4.007
12.32%
jan 1, 2000
36.149
-0.399
-1.09%
jan 1, 2001
35.435
-0.714
-1.97%
jan 1, 2002
33.243
-2.192
-6.19%
jan 1, 2003
30.708
-2.535
-7.63%
jan 1, 2004
26.871
-3.837
-12.5%
jan 1, 2005
23.196
-3.674
-13.67%
jan 1, 2006
27.913
+4.717
20.33%
jan 1, 2007
28.815
+0.902
3.23%
jan 1, 2008
33.346
+4.53
15.72%
jan 1, 2009
37.195
+3.849
11.54%
jan 1, 2010
40.571
+3.376
9.08%
jan 1, 2011
44.41
+3.839
9.46%
jan 1, 2012
46.834
+2.424
5.46%
jan 1, 2013
52.611
+5.777
12.34%
jan 1, 2014
45.004
-7.606
-14.46%
jan 1, 2015
49.261
+4.256
9.46%
jan 1, 2016
42.174
-7.087
-14.39%
Ranking of countries by current statistics by years


Comments: