29
/
en
AIzaSyAYiBZKx7MnpbEhh9jyipgxe19OcubqV5w
April 1, 2024
219399
Papua New Guinea
PNG
true
2
1
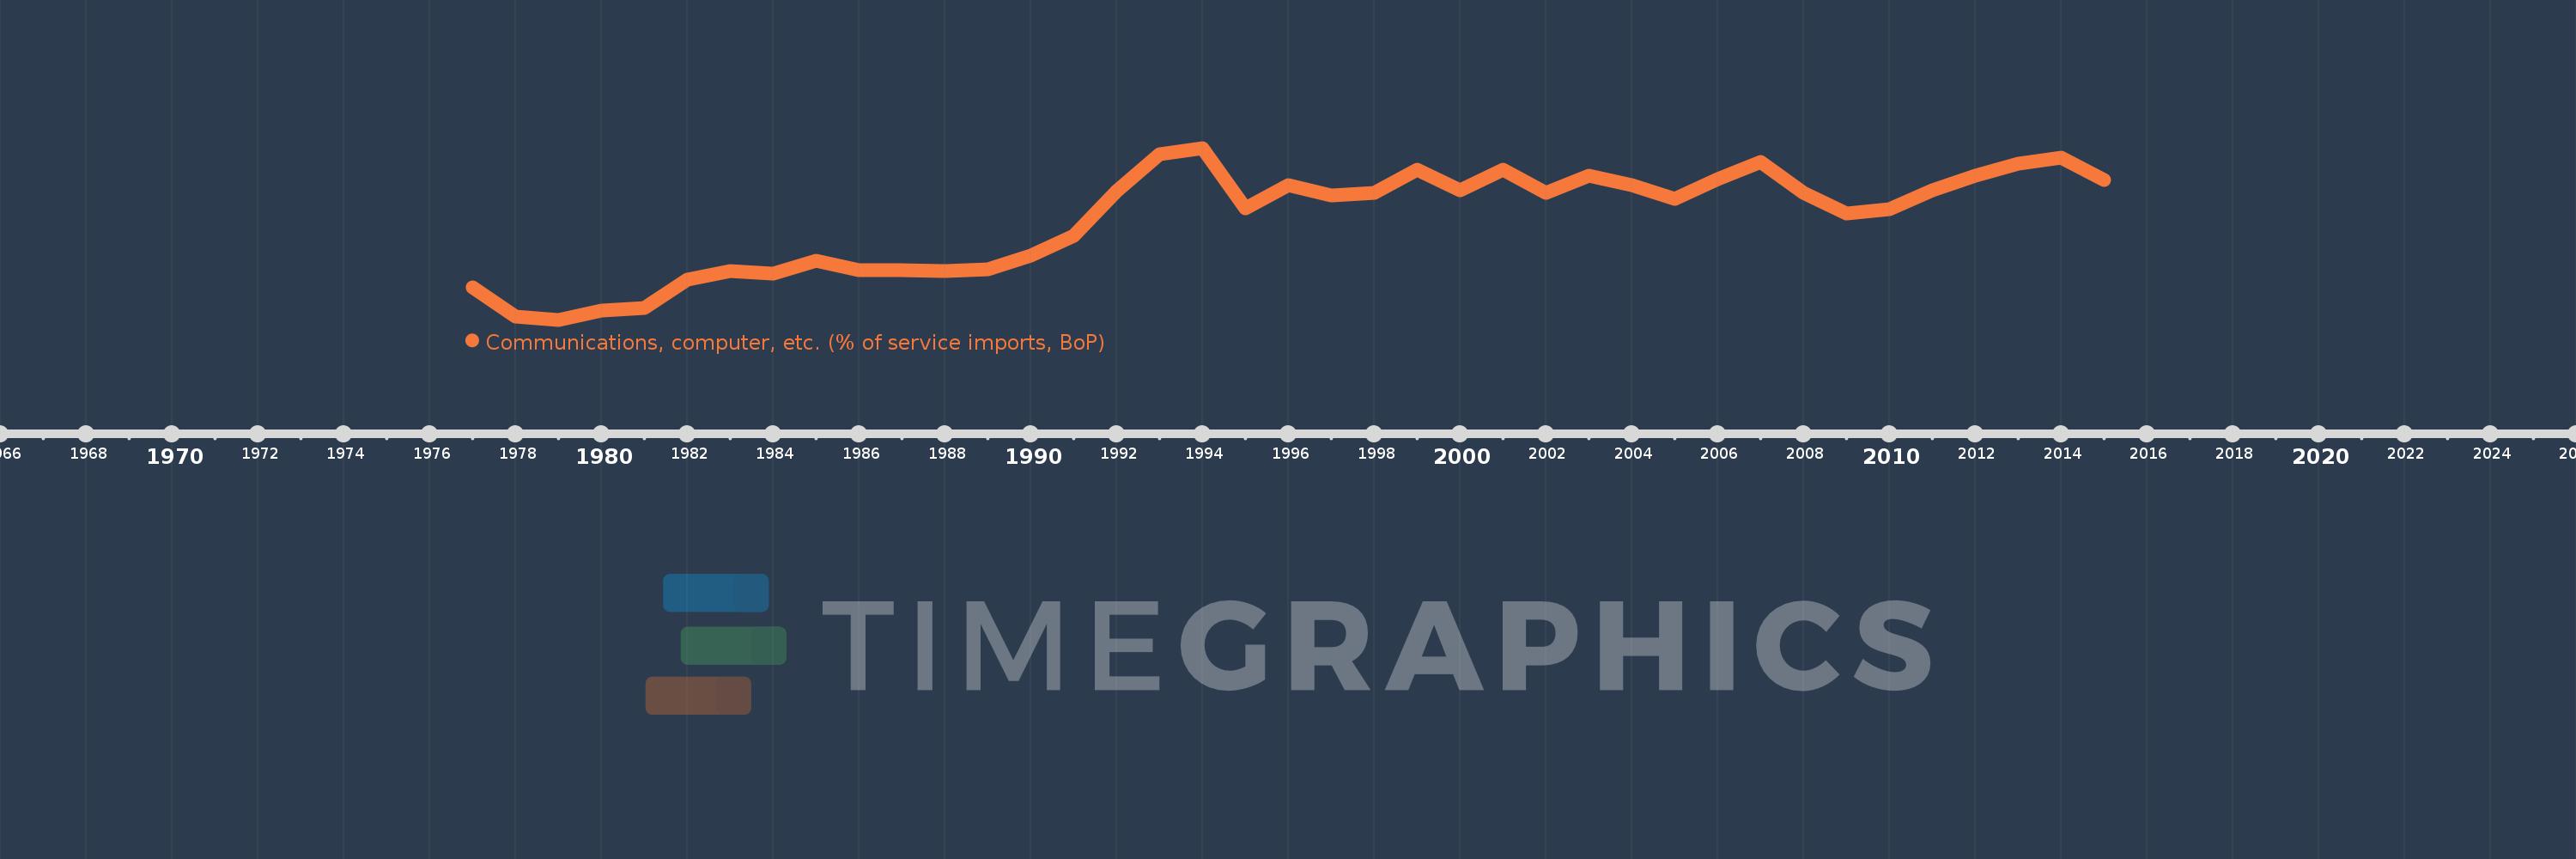
Communications, computer, etc. (% of service imports, BoP)
2015,2014,2013,2012,2011,2010,2009,2008,2007,2006,2005,2004,2003,2002,2001,2000,1999,1998,1997,1996,1995,1994,1993,1992,1991,1990,1989,1988,1987,1986,1985,1984,1983,1982,1981,1980,1979,1978,1977
This statistics in other country:
AfghanistanAlbaniaAlgeriaAngolaAntigua and BarbudaArab WorldArgentinaArmeniaArubaAustraliaAustriaAzerbaijanBahamas, TheBahrainBangladeshBarbadosBelarusBelgiumBelizeBeninBermudaBhutanBoliviaBosnia and HerzegovinaBotswanaBrazilBrunei DarussalamBulgariaBurkina FasoBurundiCabo VerdeCambodiaCameroonCanadaCaribbean small statesCentral African RepublicCentral Europe and the BalticsChadChileChinaColombiaComorosCongo, Dem. Rep.Congo, Rep.Costa RicaCote d'IvoireCroatiaCuracaoCyprusCzech RepublicDenmarkDjiboutiDominicaDominican RepublicEarly-demographic dividendEast Asia & PacificEast Asia & Pacific (excluding high income)East Asia & Pacific (IDA & IBRD countries)EcuadorEgypt, Arab Rep.El SalvadorEquatorial GuineaEritreaEstoniaEthiopiaEuro areaEurope & Central AsiaEurope & Central Asia (excluding high income)Europe & Central Asia (IDA & IBRD countries)European UnionFaroe IslandsFijiFinlandFragile and conflict affected situationsFranceFrench PolynesiaGabonGambia, TheGeorgiaGermanyGhanaGreeceGrenadaGuatemalaGuineaGuinea-BissauGuyanaHaitiHeavily indebted poor countries (HIPC)High incomeHondurasHong Kong SAR, ChinaHungaryIBRD onlyIcelandIDA & IBRD totalIDA onlyIDA totalIndiaIndonesiaIran, Islamic Rep.IraqIrelandIsraelItalyJamaicaJapanJordanKazakhstanKenyaKiribatiKorea, Rep.KosovoKuwaitKyrgyz RepublicLao PDRLate-demographic dividendLatin America & Caribbean Latin America & Caribbean (excluding high income)Latin America & the Caribbean (IDA & IBRD countries)LatviaLeast developed countries: UN classificationLebanonLesothoLiberiaLibyaLithuaniaLow & middle incomeLow incomeLower middle incomeLuxembourgMacao SAR, ChinaMacedonia, FYRMadagascarMalawiMalaysiaMaldivesMaliMaltaMarshall IslandsMauritaniaMauritiusMexicoMicronesia, Fed. Sts.Middle East & North AfricaMiddle East & North Africa (excluding high income)Middle East & North Africa (IDA & IBRD countries)Middle incomeMoldovaMongoliaMontenegroMoroccoMozambiqueMyanmarNamibiaNepalNetherlandsNew CaledoniaNew ZealandNicaraguaNigerNigeriaNorth AmericaNorwayOECD membersOmanOther small statesPacific island small statesPakistanPalauPanamaPapua New GuineaParaguayPeruPhilippinesPolandPortugalPost-demographic dividendPre-demographic dividendQatarRomaniaRussian FederationRwandaSamoaSao Tome and PrincipeSaudi ArabiaSenegalSerbiaSeychellesSierra LeoneSingaporeSint Maarten (Dutch part)Slovak RepublicSloveniaSmall statesSolomon IslandsSouth AfricaSouth AsiaSouth Asia (IDA & IBRD)South SudanSpainSri LankaSt. Kitts and NevisSt. LuciaSt. Vincent and the GrenadinesSub-Saharan Africa Sub-Saharan Africa (excluding high income)Sub-Saharan Africa (IDA & IBRD countries)SudanSurinameSwazilandSwedenSwitzerlandSyrian Arab RepublicTajikistanTanzaniaThailandTimor-LesteTogoTongaTrinidad and TobagoTunisiaTurkeyTuvaluUgandaUkraineUnited KingdomUnited StatesUpper middle incomeUruguayVanuatuVenezuela, RBWest Bank and GazaWorldYemen, Rep.ZambiaZimbabwe Timeline:
This timeline shows a graph from 1977 to 2015 of Papua New Guinea. No data until 1976. Number of actual observations by date: 39.
Source name:
World Development Indicators
Source organization:
International Monetary Fund, Balance of Payments Statistics Yearbook and data files.
Categories, topics:
Economy & Growth, Trade
Last updated:
apr 23, 2017
Indicators value changes by year
Minimum:
25.581
jan 1, 1979
Maximum:
73.144
jan 1, 1994
At the date of observation
Value
Absolute change
Change from previous value
jan 1, 1977
34.616
+34.616
0.0%
jan 1, 1978
26.357
-8.259
-23.86%
jan 1, 1979
25.581
-0.776
-2.94%
jan 1, 1980
28.056
+2.474
9.67%
jan 1, 1981
28.915
+0.86
3.06%
jan 1, 1982
36.739
+7.824
27.06%
jan 1, 1983
39.109
+2.37
6.45%
jan 1, 1984
38.428
-0.68
-1.74%
jan 1, 1985
41.935
+3.506
9.12%
jan 1, 1986
39.329
-2.606
-6.21%
jan 1, 1987
39.228
-0.101
-0.26%
jan 1, 1988
39.005
-0.223
-0.57%
jan 1, 1989
39.658
+0.653
1.67%
jan 1, 1990
43.459
+3.801
9.59%
jan 1, 1991
48.84
+5.38
12.38%
jan 1, 1992
61.165
+12.325
25.24%
jan 1, 1993
71.509
+10.345
16.91%
jan 1, 1994
73.144
+1.635
2.29%
jan 1, 1995
56.544
-16.6
-22.69%
jan 1, 1996
62.957
+6.413
11.34%
jan 1, 1997
60.051
-2.905
-4.61%
jan 1, 1998
60.744
+0.692
1.15%
jan 1, 1999
67.05
+6.306
10.38%
jan 1, 2000
61.444
-5.606
-8.36%
jan 1, 2001
67.186
+5.742
9.35%
jan 1, 2002
60.808
-6.378
-9.49%
jan 1, 2003
65.577
+4.768
7.84%
jan 1, 2004
62.793
-2.783
-4.24%
jan 1, 2005
59.054
-3.739
-5.95%
jan 1, 2006
64.609
+5.555
9.41%
jan 1, 2007
69.382
+4.773
7.39%
jan 1, 2008
60.797
-8.585
-12.37%
jan 1, 2009
54.976
-5.821
-9.57%
jan 1, 2010
56.121
+1.145
2.08%
jan 1, 2011
61.517
+5.396
9.61%
jan 1, 2012
65.439
+3.922
6.38%
jan 1, 2013
68.904
+3.464
5.29%
jan 1, 2014
70.557
+1.653
2.4%
jan 1, 2015
64.229
-6.328
-8.97%
Ranking of countries by current statistics by years


Comments: