29
/
en
AIzaSyAYiBZKx7MnpbEhh9jyipgxe19OcubqV5w
April 1, 2024
285658
Zambia
ZMB
true
2
1
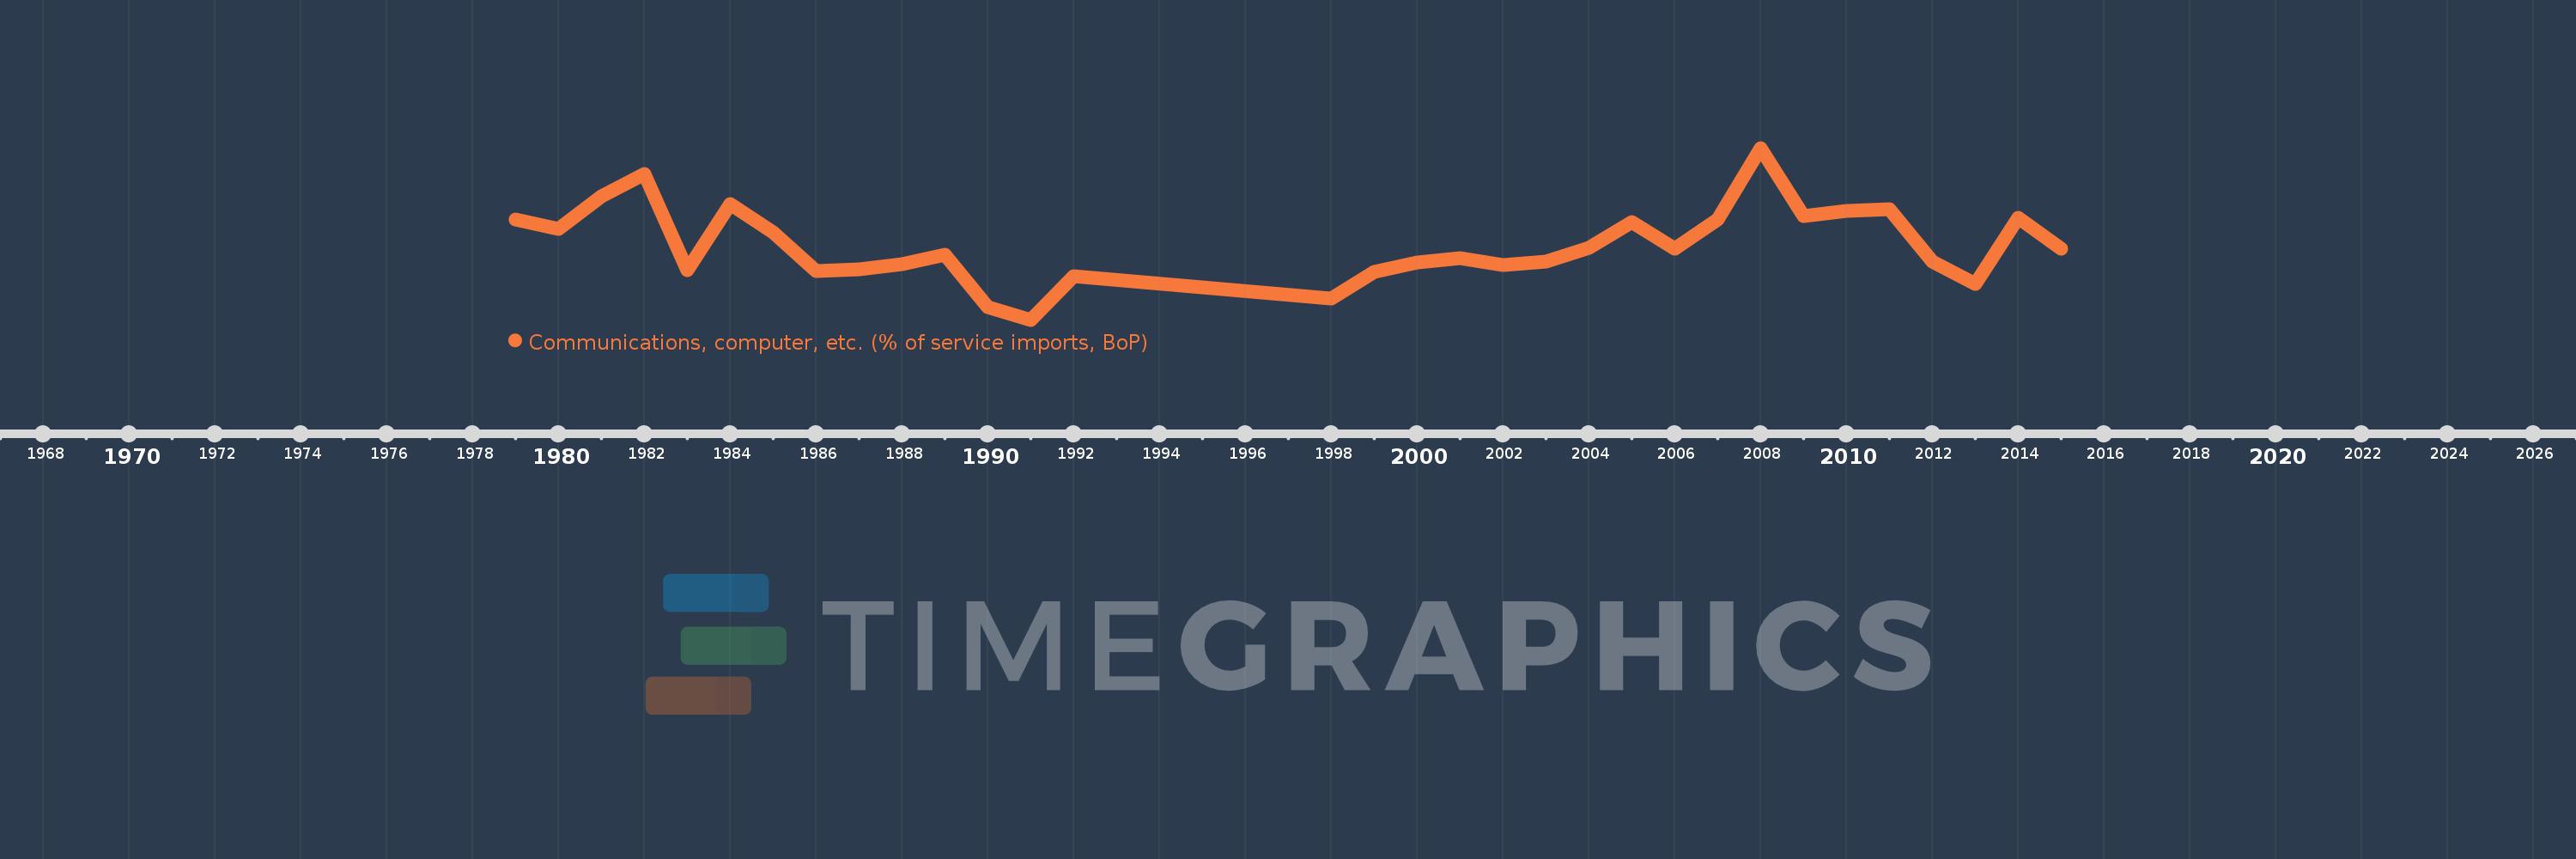
Communications, computer, etc. (% of service imports, BoP)
2015,2014,2013,2012,2011,2010,2009,2008,2007,2006,2005,2004,2003,2002,2001,2000,1999,1998,1992,1991,1990,1989,1988,1987,1986,1985,1984,1983,1982,1981,1980,1979
This statistics in other country:
AfghanistanAlbaniaAlgeriaAngolaAntigua and BarbudaArab WorldArgentinaArmeniaArubaAustraliaAustriaAzerbaijanBahamas, TheBahrainBangladeshBarbadosBelarusBelgiumBelizeBeninBermudaBhutanBoliviaBosnia and HerzegovinaBotswanaBrazilBrunei DarussalamBulgariaBurkina FasoBurundiCabo VerdeCambodiaCameroonCanadaCaribbean small statesCentral African RepublicCentral Europe and the BalticsChadChileChinaColombiaComorosCongo, Dem. Rep.Congo, Rep.Costa RicaCote d'IvoireCroatiaCuracaoCyprusCzech RepublicDenmarkDjiboutiDominicaDominican RepublicEarly-demographic dividendEast Asia & PacificEast Asia & Pacific (excluding high income)East Asia & Pacific (IDA & IBRD countries)EcuadorEgypt, Arab Rep.El SalvadorEquatorial GuineaEritreaEstoniaEthiopiaEuro areaEurope & Central AsiaEurope & Central Asia (excluding high income)Europe & Central Asia (IDA & IBRD countries)European UnionFaroe IslandsFijiFinlandFragile and conflict affected situationsFranceFrench PolynesiaGabonGambia, TheGeorgiaGermanyGhanaGreeceGrenadaGuatemalaGuineaGuinea-BissauGuyanaHaitiHeavily indebted poor countries (HIPC)High incomeHondurasHong Kong SAR, ChinaHungaryIBRD onlyIcelandIDA & IBRD totalIDA onlyIDA totalIndiaIndonesiaIran, Islamic Rep.IraqIrelandIsraelItalyJamaicaJapanJordanKazakhstanKenyaKiribatiKorea, Rep.KosovoKuwaitKyrgyz RepublicLao PDRLate-demographic dividendLatin America & Caribbean Latin America & Caribbean (excluding high income)Latin America & the Caribbean (IDA & IBRD countries)LatviaLeast developed countries: UN classificationLebanonLesothoLiberiaLibyaLithuaniaLow & middle incomeLow incomeLower middle incomeLuxembourgMacao SAR, ChinaMacedonia, FYRMadagascarMalawiMalaysiaMaldivesMaliMaltaMarshall IslandsMauritaniaMauritiusMexicoMicronesia, Fed. Sts.Middle East & North AfricaMiddle East & North Africa (excluding high income)Middle East & North Africa (IDA & IBRD countries)Middle incomeMoldovaMongoliaMontenegroMoroccoMozambiqueMyanmarNamibiaNepalNetherlandsNew CaledoniaNew ZealandNicaraguaNigerNigeriaNorth AmericaNorwayOECD membersOmanOther small statesPacific island small statesPakistanPalauPanamaPapua New GuineaParaguayPeruPhilippinesPolandPortugalPost-demographic dividendPre-demographic dividendQatarRomaniaRussian FederationRwandaSamoaSao Tome and PrincipeSaudi ArabiaSenegalSerbiaSeychellesSierra LeoneSingaporeSint Maarten (Dutch part)Slovak RepublicSloveniaSmall statesSolomon IslandsSouth AfricaSouth AsiaSouth Asia (IDA & IBRD)South SudanSpainSri LankaSt. Kitts and NevisSt. LuciaSt. Vincent and the GrenadinesSub-Saharan Africa Sub-Saharan Africa (excluding high income)Sub-Saharan Africa (IDA & IBRD countries)SudanSurinameSwazilandSwedenSwitzerlandSyrian Arab RepublicTajikistanTanzaniaThailandTimor-LesteTogoTongaTrinidad and TobagoTunisiaTurkeyTuvaluUgandaUkraineUnited KingdomUnited StatesUpper middle incomeUruguayVanuatuVenezuela, RBWest Bank and GazaWorldYemen, Rep.ZambiaZimbabwe Timeline:
This timeline shows a graph from 1979 to 2015 of Zambia. No data until 1978. Number of actual observations by date: 32.
Source name:
World Development Indicators
Source organization:
International Monetary Fund, Balance of Payments Statistics Yearbook and data files.
Categories, topics:
Economy & Growth, Trade
Last updated:
apr 23, 2017
Indicators value changes by year
Maximum:
44.354
jan 1, 2008
At the date of observation
Value
Absolute change
Change from previous value
jan 1, 1979
28.876
+28.876
0.0%
jan 1, 1980
26.864
-2.012
-6.97%
jan 1, 1981
33.927
+7.063
26.29%
jan 1, 1982
38.785
+4.858
14.32%
jan 1, 1983
18.037
-20.748
-53.49%
jan 1, 1984
32.186
+14.148
78.44%
jan 1, 1985
26.162
-6.024
-18.72%
jan 1, 1986
17.917
-8.244
-31.51%
jan 1, 1987
18.26
+0.342
1.91%
jan 1, 1988
19.283
+1.023
5.6%
jan 1, 1989
21.377
+2.094
10.86%
jan 1, 1990
10.07
-11.307
-52.89%
jan 1, 1991
7.33
-2.74
-27.21%
jan 1, 1992
16.676
+9.346
127.51%
jan 1, 1998
11.928
-4.748
-28.47%
jan 1, 1999
17.59
+5.662
47.47%
jan 1, 2000
19.588
+1.998
11.36%
jan 1, 2001
20.59
+1.002
5.12%
jan 1, 2002
19.202
-1.388
-6.74%
jan 1, 2003
19.824
+0.622
3.24%
jan 1, 2004
22.757
+2.933
14.79%
jan 1, 2005
28.303
+5.547
24.37%
jan 1, 2006
22.712
-5.591
-19.75%
jan 1, 2007
28.967
+6.254
27.54%
jan 1, 2008
44.354
+15.387
53.12%
jan 1, 2009
29.674
-14.679
-33.1%
jan 1, 2010
30.822
+1.147
3.87%
jan 1, 2011
31.222
+0.4
1.3%
jan 1, 2012
19.907
-11.315
-36.24%
jan 1, 2013
14.959
-4.947
-24.85%
jan 1, 2014
29.341
+14.381
96.14%
jan 1, 2015
22.63
-6.711
-22.87%
Ranking of countries by current statistics by years


Comments: