29
/
en
AIzaSyAYiBZKx7MnpbEhh9jyipgxe19OcubqV5w
April 1, 2024
104675
Chile
CHL
true
2
1
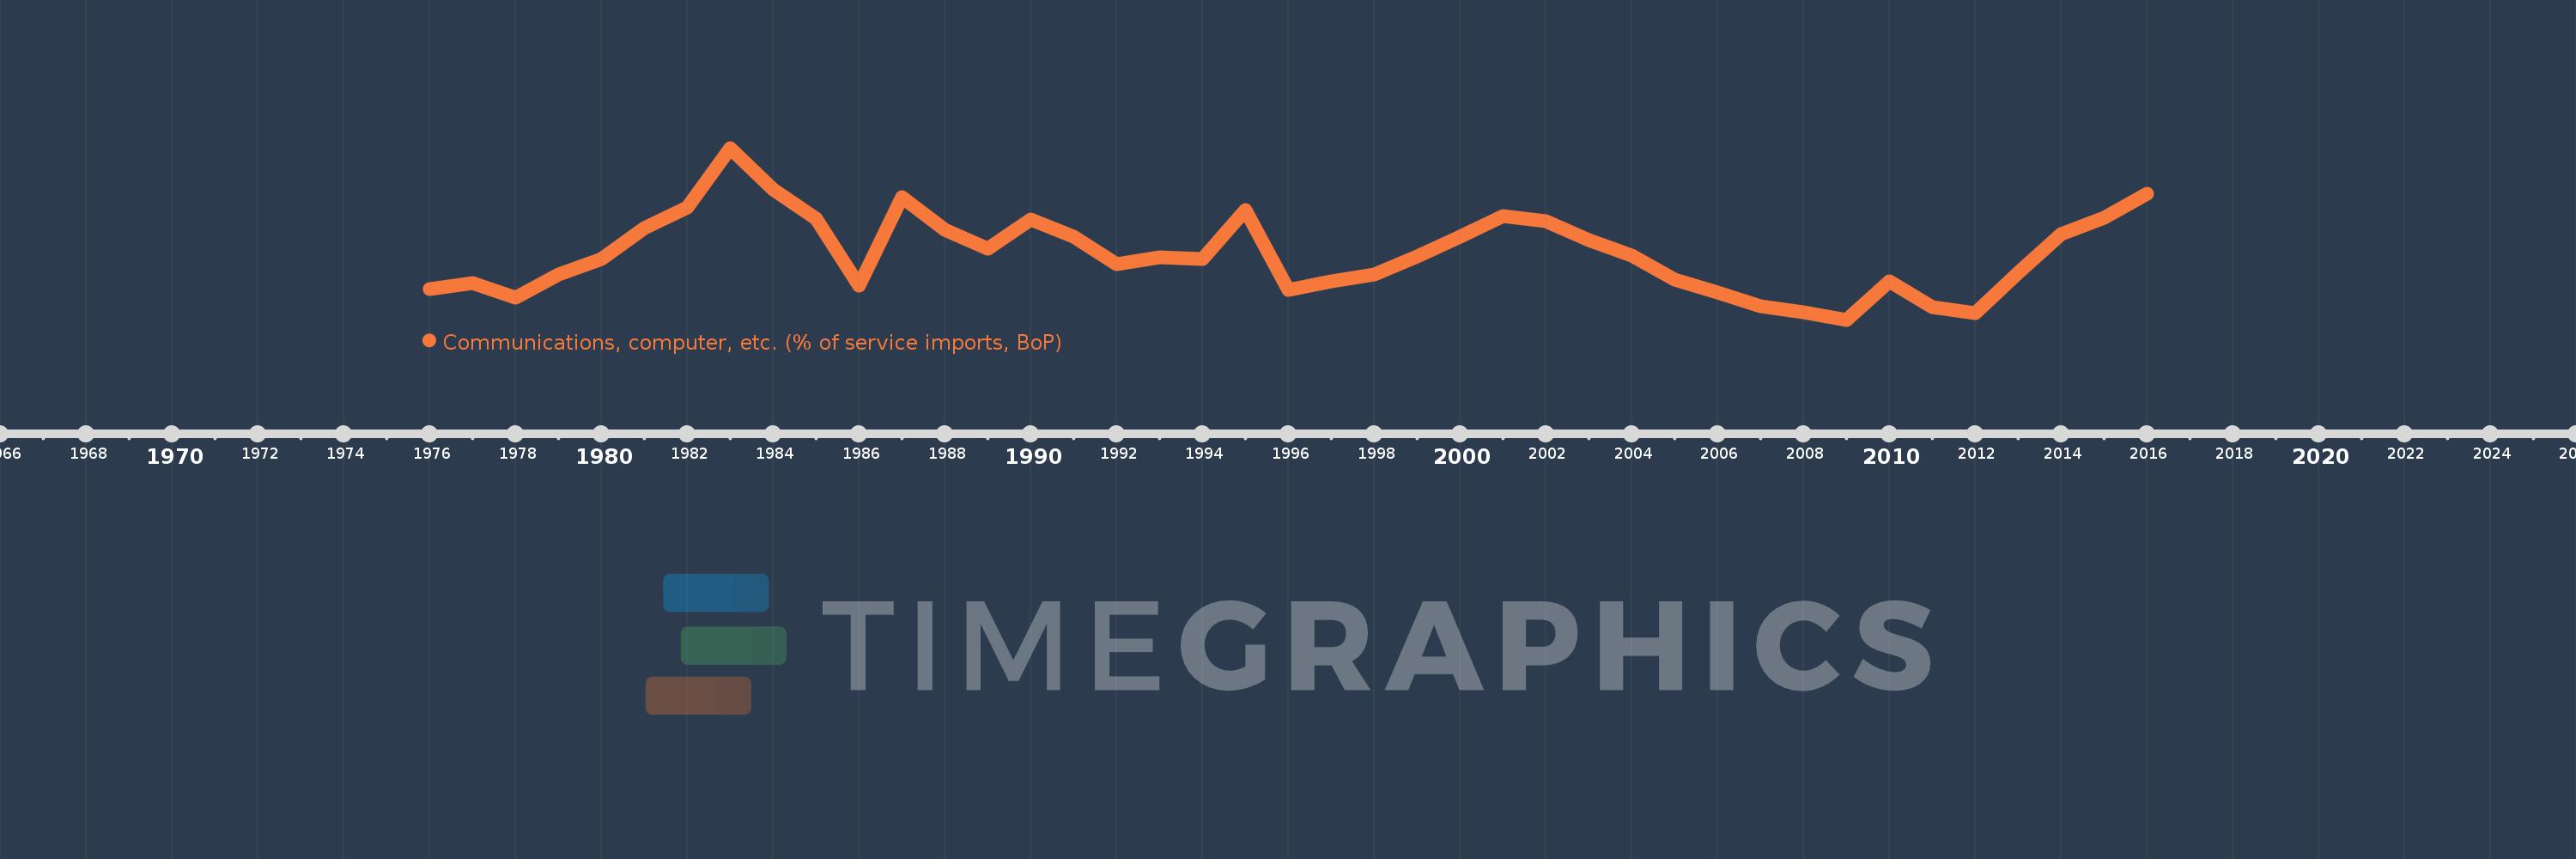
Communications, computer, etc. (% of service imports, BoP)
2016,2015,2014,2013,2012,2011,2010,2009,2008,2007,2006,2005,2004,2003,2002,2001,2000,1999,1998,1997,1996,1995,1994,1993,1992,1991,1990,1989,1988,1987,1986,1985,1984,1983,1982,1981,1980,1979,1978,1977,1976
This statistics in other country:
AfghanistanAlbaniaAlgeriaAngolaAntigua and BarbudaArab WorldArgentinaArmeniaArubaAustraliaAustriaAzerbaijanBahamas, TheBahrainBangladeshBarbadosBelarusBelgiumBelizeBeninBermudaBhutanBoliviaBosnia and HerzegovinaBotswanaBrazilBrunei DarussalamBulgariaBurkina FasoBurundiCabo VerdeCambodiaCameroonCanadaCaribbean small statesCentral African RepublicCentral Europe and the BalticsChadChileChinaColombiaComorosCongo, Dem. Rep.Congo, Rep.Costa RicaCote d'IvoireCroatiaCuracaoCyprusCzech RepublicDenmarkDjiboutiDominicaDominican RepublicEarly-demographic dividendEast Asia & PacificEast Asia & Pacific (excluding high income)East Asia & Pacific (IDA & IBRD countries)EcuadorEgypt, Arab Rep.El SalvadorEquatorial GuineaEritreaEstoniaEthiopiaEuro areaEurope & Central AsiaEurope & Central Asia (excluding high income)Europe & Central Asia (IDA & IBRD countries)European UnionFaroe IslandsFijiFinlandFragile and conflict affected situationsFranceFrench PolynesiaGabonGambia, TheGeorgiaGermanyGhanaGreeceGrenadaGuatemalaGuineaGuinea-BissauGuyanaHaitiHeavily indebted poor countries (HIPC)High incomeHondurasHong Kong SAR, ChinaHungaryIBRD onlyIcelandIDA & IBRD totalIDA onlyIDA totalIndiaIndonesiaIran, Islamic Rep.IraqIrelandIsraelItalyJamaicaJapanJordanKazakhstanKenyaKiribatiKorea, Rep.KosovoKuwaitKyrgyz RepublicLao PDRLate-demographic dividendLatin America & Caribbean Latin America & Caribbean (excluding high income)Latin America & the Caribbean (IDA & IBRD countries)LatviaLeast developed countries: UN classificationLebanonLesothoLiberiaLibyaLithuaniaLow & middle incomeLow incomeLower middle incomeLuxembourgMacao SAR, ChinaMacedonia, FYRMadagascarMalawiMalaysiaMaldivesMaliMaltaMarshall IslandsMauritaniaMauritiusMexicoMicronesia, Fed. Sts.Middle East & North AfricaMiddle East & North Africa (excluding high income)Middle East & North Africa (IDA & IBRD countries)Middle incomeMoldovaMongoliaMontenegroMoroccoMozambiqueMyanmarNamibiaNepalNetherlandsNew CaledoniaNew ZealandNicaraguaNigerNigeriaNorth AmericaNorwayOECD membersOmanOther small statesPacific island small statesPakistanPalauPanamaPapua New GuineaParaguayPeruPhilippinesPolandPortugalPost-demographic dividendPre-demographic dividendQatarRomaniaRussian FederationRwandaSamoaSao Tome and PrincipeSaudi ArabiaSenegalSerbiaSeychellesSierra LeoneSingaporeSint Maarten (Dutch part)Slovak RepublicSloveniaSmall statesSolomon IslandsSouth AfricaSouth AsiaSouth Asia (IDA & IBRD)South SudanSpainSri LankaSt. Kitts and NevisSt. LuciaSt. Vincent and the GrenadinesSub-Saharan Africa Sub-Saharan Africa (excluding high income)Sub-Saharan Africa (IDA & IBRD countries)SudanSurinameSwazilandSwedenSwitzerlandSyrian Arab RepublicTajikistanTanzaniaThailandTimor-LesteTogoTongaTrinidad and TobagoTunisiaTurkeyTuvaluUgandaUkraineUnited KingdomUnited StatesUpper middle incomeUruguayVanuatuVenezuela, RBWest Bank and GazaWorldYemen, Rep.ZambiaZimbabwe Timeline:
This timeline shows a graph from 1976 to 2016 of Chile. No data until 1975. Number of actual observations by date: 41.
Source name:
World Development Indicators
Source organization:
International Monetary Fund, Balance of Payments Statistics Yearbook and data files.
Categories, topics:
Economy & Growth, Trade
Last updated:
apr 23, 2017
Indicators value changes by year
Minimum:
21.168
jan 1, 2009
Maximum:
41.915
jan 1, 1983
At the date of observation
Value
Absolute change
Change from previous value
jan 1, 1976
24.86
+24.86
0.0%
jan 1, 1977
25.631
+0.771
3.1%
jan 1, 1978
23.842
-1.789
-6.98%
jan 1, 1979
26.631
+2.789
11.7%
jan 1, 1980
28.531
+1.899
7.13%
jan 1, 1981
32.28
+3.75
13.14%
jan 1, 1982
34.775
+2.495
7.73%
jan 1, 1983
41.915
+7.14
20.53%
jan 1, 1984
36.893
-5.022
-11.98%
jan 1, 1985
33.389
-3.505
-9.5%
jan 1, 1986
25.312
-8.076
-24.19%
jan 1, 1987
36.017
+10.705
42.29%
jan 1, 1988
32.079
-3.938
-10.93%
jan 1, 1989
29.707
-2.372
-7.39%
jan 1, 1990
33.225
+3.518
11.84%
jan 1, 1991
31.151
-2.073
-6.24%
jan 1, 1992
27.858
-3.293
-10.57%
jan 1, 1993
28.73
+0.872
3.13%
jan 1, 1994
28.523
-0.207
-0.72%
jan 1, 1995
34.428
+5.905
20.7%
jan 1, 1996
24.774
-9.653
-28.04%
jan 1, 1997
25.851
+1.076
4.34%
jan 1, 1998
26.591
+0.74
2.86%
jan 1, 1999
28.844
+2.252
8.47%
jan 1, 2000
31.187
+2.343
8.12%
jan 1, 2001
33.702
+2.516
8.07%
jan 1, 2002
33.091
-0.612
-1.82%
jan 1, 2003
30.797
-2.294
-6.93%
jan 1, 2004
28.878
-1.918
-6.23%
jan 1, 2005
26.01
-2.868
-9.93%
jan 1, 2006
24.481
-1.528
-5.88%
jan 1, 2007
22.807
-1.674
-6.84%
jan 1, 2008
22.024
-0.783
-3.43%
jan 1, 2009
21.168
-0.857
-3.89%
jan 1, 2010
25.826
+4.658
22.01%
jan 1, 2011
22.701
-3.125
-12.1%
jan 1, 2012
21.994
-0.707
-3.12%
jan 1, 2013
26.865
+4.872
22.15%
jan 1, 2014
31.459
+4.594
17.1%
jan 1, 2015
33.439
+1.979
6.29%
jan 1, 2016
36.408
+2.969
8.88%
Ranking of countries by current statistics by years


Comments: