29
/
en
AIzaSyAYiBZKx7MnpbEhh9jyipgxe19OcubqV5w
April 1, 2024
100929
Canada
CAN
true
2
1
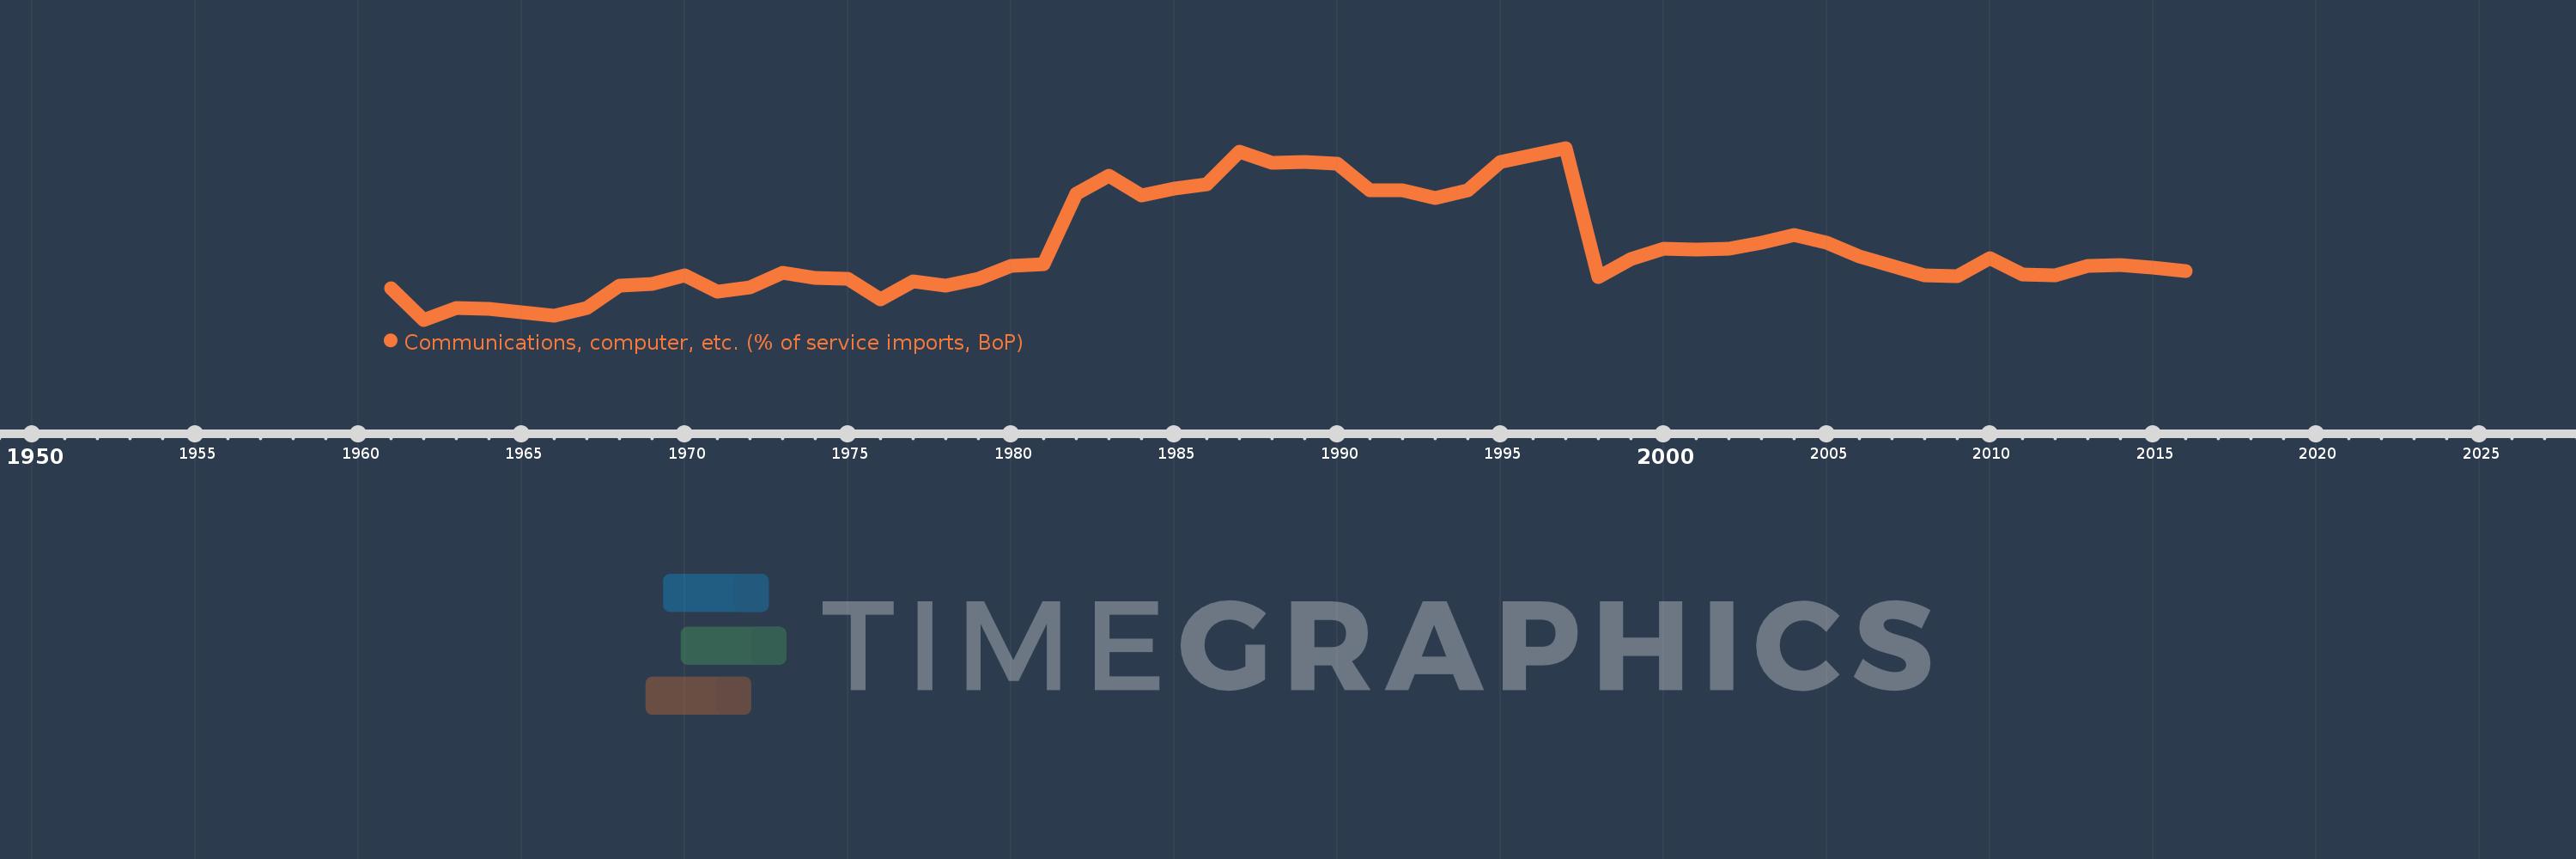
Communications, computer, etc. (% of service imports, BoP)
2016,2015,2014,2013,2012,2011,2010,2009,2008,2007,2006,2005,2004,2003,2002,2001,2000,1999,1998,1997,1996,1995,1994,1993,1992,1991,1990,1989,1988,1987,1986,1985,1984,1983,1982,1981,1980,1979,1978,1977,1976,1975,1974,1973,1972,1971,1970,1969,1968,1967,1966,1965,1964,1963,1962,1961
This statistics in other country:
AfghanistanAlbaniaAlgeriaAngolaAntigua and BarbudaArab WorldArgentinaArmeniaArubaAustraliaAustriaAzerbaijanBahamas, TheBahrainBangladeshBarbadosBelarusBelgiumBelizeBeninBermudaBhutanBoliviaBosnia and HerzegovinaBotswanaBrazilBrunei DarussalamBulgariaBurkina FasoBurundiCabo VerdeCambodiaCameroonCanadaCaribbean small statesCentral African RepublicCentral Europe and the BalticsChadChileChinaColombiaComorosCongo, Dem. Rep.Congo, Rep.Costa RicaCote d'IvoireCroatiaCuracaoCyprusCzech RepublicDenmarkDjiboutiDominicaDominican RepublicEarly-demographic dividendEast Asia & PacificEast Asia & Pacific (excluding high income)East Asia & Pacific (IDA & IBRD countries)EcuadorEgypt, Arab Rep.El SalvadorEquatorial GuineaEritreaEstoniaEthiopiaEuro areaEurope & Central AsiaEurope & Central Asia (excluding high income)Europe & Central Asia (IDA & IBRD countries)European UnionFaroe IslandsFijiFinlandFragile and conflict affected situationsFranceFrench PolynesiaGabonGambia, TheGeorgiaGermanyGhanaGreeceGrenadaGuatemalaGuineaGuinea-BissauGuyanaHaitiHeavily indebted poor countries (HIPC)High incomeHondurasHong Kong SAR, ChinaHungaryIBRD onlyIcelandIDA & IBRD totalIDA onlyIDA totalIndiaIndonesiaIran, Islamic Rep.IraqIrelandIsraelItalyJamaicaJapanJordanKazakhstanKenyaKiribatiKorea, Rep.KosovoKuwaitKyrgyz RepublicLao PDRLate-demographic dividendLatin America & Caribbean Latin America & Caribbean (excluding high income)Latin America & the Caribbean (IDA & IBRD countries)LatviaLeast developed countries: UN classificationLebanonLesothoLiberiaLibyaLithuaniaLow & middle incomeLow incomeLower middle incomeLuxembourgMacao SAR, ChinaMacedonia, FYRMadagascarMalawiMalaysiaMaldivesMaliMaltaMarshall IslandsMauritaniaMauritiusMexicoMicronesia, Fed. Sts.Middle East & North AfricaMiddle East & North Africa (excluding high income)Middle East & North Africa (IDA & IBRD countries)Middle incomeMoldovaMongoliaMontenegroMoroccoMozambiqueMyanmarNamibiaNepalNetherlandsNew CaledoniaNew ZealandNicaraguaNigerNigeriaNorth AmericaNorwayOECD membersOmanOther small statesPacific island small statesPakistanPalauPanamaPapua New GuineaParaguayPeruPhilippinesPolandPortugalPost-demographic dividendPre-demographic dividendQatarRomaniaRussian FederationRwandaSamoaSao Tome and PrincipeSaudi ArabiaSenegalSerbiaSeychellesSierra LeoneSingaporeSint Maarten (Dutch part)Slovak RepublicSloveniaSmall statesSolomon IslandsSouth AfricaSouth AsiaSouth Asia (IDA & IBRD)South SudanSpainSri LankaSt. Kitts and NevisSt. LuciaSt. Vincent and the GrenadinesSub-Saharan Africa Sub-Saharan Africa (excluding high income)Sub-Saharan Africa (IDA & IBRD countries)SudanSurinameSwazilandSwedenSwitzerlandSyrian Arab RepublicTajikistanTanzaniaThailandTimor-LesteTogoTongaTrinidad and TobagoTunisiaTurkeyTuvaluUgandaUkraineUnited KingdomUnited StatesUpper middle incomeUruguayVanuatuVenezuela, RBWest Bank and GazaWorldYemen, Rep.ZambiaZimbabwe Timeline:
This timeline shows a graph from 1961 to 2016 of Canada. No data until 1960. Number of actual observations by date: 56.
Source name:
World Development Indicators
Source organization:
International Monetary Fund, Balance of Payments Statistics Yearbook and data files.
Categories, topics:
Economy & Growth, Trade
Last updated:
apr 23, 2017
Indicators value changes by year
Minimum:
29.553
jan 1, 1962
Maximum:
59.186
jan 1, 1997
At the date of observation
Value
Absolute change
Change from previous value
jan 1, 1961
35.003
+35.003
0.0%
jan 1, 1962
29.553
-5.45
-15.57%
jan 1, 1963
31.62
+2.067
6.99%
jan 1, 1964
31.448
-0.172
-0.54%
jan 1, 1965
30.86
-0.588
-1.87%
jan 1, 1966
30.18
-0.68
-2.2%
jan 1, 1967
31.632
+1.453
4.81%
jan 1, 1968
35.489
+3.857
12.19%
jan 1, 1969
35.776
+0.287
0.81%
jan 1, 1970
37.218
+1.442
4.03%
jan 1, 1971
34.395
-2.824
-7.59%
jan 1, 1972
35.099
+0.704
2.05%
jan 1, 1973
37.635
+2.536
7.23%
jan 1, 1974
36.793
-0.843
-2.24%
jan 1, 1975
36.568
-0.224
-0.61%
jan 1, 1976
33.045
-3.523
-9.64%
jan 1, 1977
36.127
+3.082
9.33%
jan 1, 1978
35.499
-0.628
-1.74%
jan 1, 1979
36.632
+1.133
3.19%
jan 1, 1980
38.914
+2.282
6.23%
jan 1, 1981
39.196
+0.283
0.73%
jan 1, 1982
51.297
+12.101
30.87%
jan 1, 1983
54.465
+3.168
6.18%
jan 1, 1984
50.988
-3.476
-6.38%
jan 1, 1985
52.2
+1.211
2.38%
jan 1, 1986
52.949
+0.75
1.44%
jan 1, 1987
58.598
+5.648
10.67%
jan 1, 1988
56.617
-1.981
-3.38%
jan 1, 1989
56.721
+0.104
0.18%
jan 1, 1990
56.545
-0.176
-0.31%
jan 1, 1991
51.92
-4.625
-8.18%
jan 1, 1992
51.92
+0.0
0.0%
jan 1, 1993
50.53
-1.39
-2.68%
jan 1, 1994
51.91
+1.381
2.73%
jan 1, 1995
56.71
+4.799
9.25%
jan 1, 1996
57.923
+1.214
2.14%
jan 1, 1997
59.186
+1.262
2.18%
jan 1, 1998
36.859
-22.327
-37.72%
jan 1, 1999
39.979
+3.119
8.46%
jan 1, 2000
41.781
+1.802
4.51%
jan 1, 2001
41.608
-0.174
-0.42%
jan 1, 2002
41.771
+0.163
0.39%
jan 1, 2003
42.9
+1.129
2.7%
jan 1, 2004
44.11
+1.21
2.82%
jan 1, 2005
42.815
-1.295
-2.94%
jan 1, 2006
40.494
-2.321
-5.42%
jan 1, 2007
38.863
-1.631
-4.03%
jan 1, 2008
37.152
-1.711
-4.4%
jan 1, 2009
37.047
-0.105
-0.28%
jan 1, 2010
40.161
+3.114
8.41%
jan 1, 2011
37.324
-2.837
-7.06%
jan 1, 2012
37.273
-0.051
-0.14%
jan 1, 2013
38.815
+1.541
4.14%
jan 1, 2014
39.039
+0.224
0.58%
jan 1, 2015
38.527
-0.512
-1.31%
jan 1, 2016
37.908
-0.619
-1.61%
Ranking of countries by current statistics by years


Comments: