29
/
en
AIzaSyAYiBZKx7MnpbEhh9jyipgxe19OcubqV5w
April 1, 2024
87071
Bolivia
BOL
true
2
1
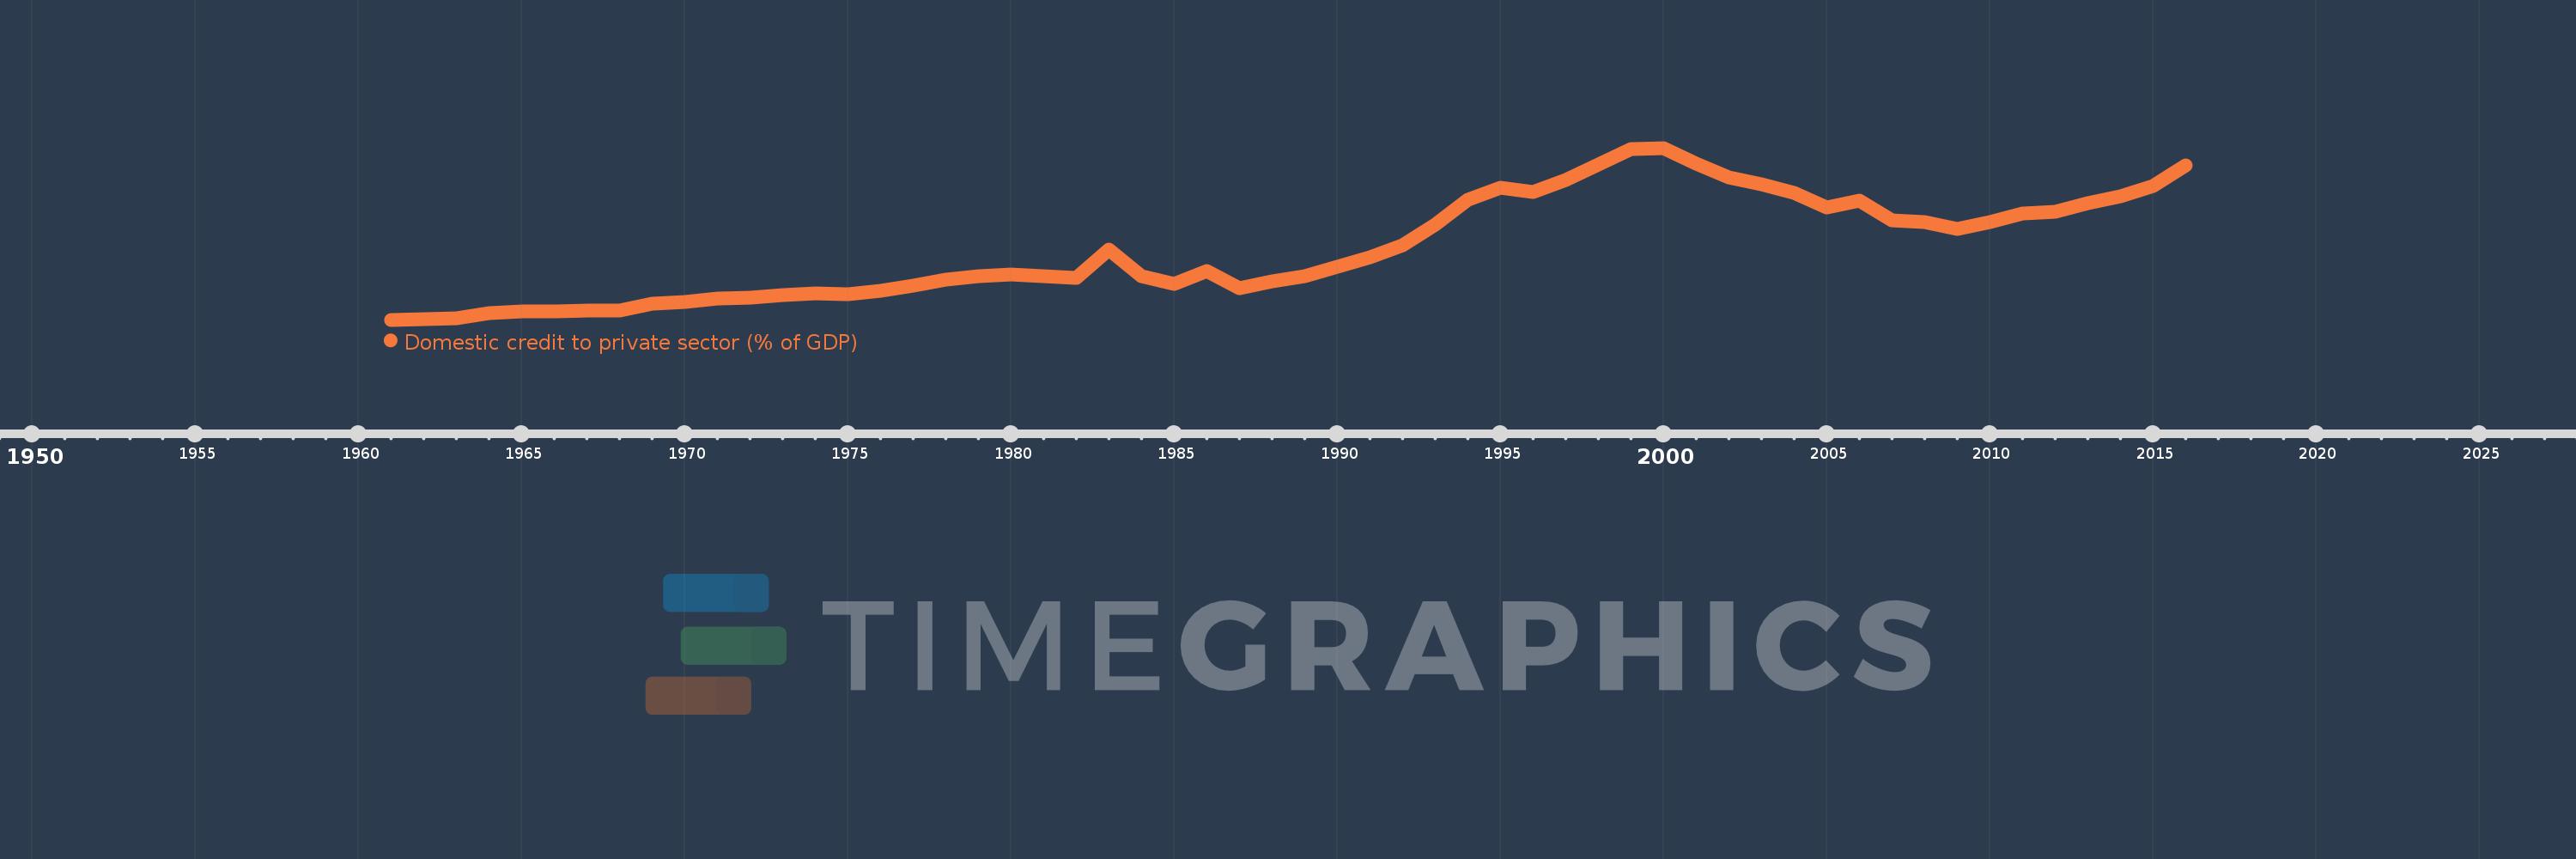
Domestic credit to private sector (% of GDP)
2016,2015,2014,2013,2012,2011,2010,2009,2008,2007,2006,2005,2004,2003,2002,2001,2000,1999,1998,1997,1996,1995,1994,1993,1992,1991,1990,1989,1988,1987,1986,1985,1984,1983,1982,1981,1980,1979,1978,1977,1976,1975,1974,1973,1972,1971,1970,1969,1968,1967,1966,1965,1964,1963,1962,1961
This statistics in other country:
AfghanistanAlbaniaAlgeriaAngolaAntigua and BarbudaArab WorldArgentinaArmeniaArubaAustraliaAustriaAzerbaijanBahamas, TheBahrainBangladeshBarbadosBelarusBelgiumBelizeBeninBhutanBoliviaBosnia and HerzegovinaBotswanaBrazilBrunei DarussalamBulgariaBurkina FasoBurundiCabo VerdeCambodiaCameroonCanadaCaribbean small statesCentral African RepublicCentral Europe and the BalticsChadChileChinaColombiaComorosCongo, Dem. Rep.Congo, Rep.Costa RicaCote d'IvoireCroatiaCyprusCzech RepublicDenmarkDjiboutiDominicaDominican RepublicEarly-demographic dividendEast Asia & PacificEast Asia & Pacific (excluding high income)East Asia & Pacific (IDA & IBRD countries)EcuadorEgypt, Arab Rep.El SalvadorEquatorial GuineaEritreaEstoniaEthiopiaEuro areaEurope & Central AsiaEurope & Central Asia (excluding high income)Europe & Central Asia (IDA & IBRD countries)European UnionFijiFinlandFragile and conflict affected situationsFranceGabonGambia, TheGeorgiaGermanyGhanaGreeceGrenadaGuatemalaGuineaGuinea-BissauGuyanaHaitiHeavily indebted poor countries (HIPC)High incomeHondurasHong Kong SAR, ChinaHungaryIBRD onlyIcelandIDA & IBRD totalIDA blendIDA onlyIDA totalIndiaIndonesiaIran, Islamic Rep.IraqIrelandIsraelItalyJamaicaJapanJordanKazakhstanKenyaKorea, Rep.KosovoKuwaitKyrgyz RepublicLao PDRLate-demographic dividendLatin America & Caribbean Latin America & Caribbean (excluding high income)Latin America & the Caribbean (IDA & IBRD countries)LatviaLeast developed countries: UN classificationLebanonLesothoLiberiaLibyaLithuaniaLow & middle incomeLow incomeLower middle incomeLuxembourgMacao SAR, ChinaMacedonia, FYRMadagascarMalawiMalaysiaMaldivesMaliMaltaMauritaniaMauritiusMexicoMicronesia, Fed. Sts.Middle East & North AfricaMiddle East & North Africa (excluding high income)Middle East & North Africa (IDA & IBRD countries)Middle incomeMoldovaMongoliaMontenegroMoroccoMozambiqueMyanmarNamibiaNepalNetherlandsNew ZealandNicaraguaNigerNigeriaNorth AmericaNorwayOECD membersOmanOther small statesPacific island small statesPakistanPanamaPapua New GuineaParaguayPeruPhilippinesPolandPortugalPost-demographic dividendPre-demographic dividendQatarRomaniaRussian FederationRwandaSamoaSao Tome and PrincipeSaudi ArabiaSenegalSerbiaSeychellesSierra LeoneSingaporeSlovak RepublicSloveniaSmall statesSolomon IslandsSouth AfricaSouth AsiaSouth Asia (IDA & IBRD)South SudanSpainSri LankaSt. Kitts and NevisSt. LuciaSt. Vincent and the GrenadinesSub-Saharan Africa Sub-Saharan Africa (excluding high income)Sub-Saharan Africa (IDA & IBRD countries)SudanSurinameSwazilandSwedenSwitzerlandSyrian Arab RepublicTajikistanTanzaniaThailandTimor-LesteTogoTongaTrinidad and TobagoTunisiaTurkeyUgandaUkraineUnited Arab EmiratesUnited KingdomUnited StatesUpper middle incomeUruguayVanuatuVenezuela, RBVietnamWest Bank and GazaWorldYemen, Rep.ZambiaZimbabwe Timeline:
This timeline shows a graph from 1961 to 2016 of Bolivia. No data until 1960. Number of actual observations by date: 56.
Source name:
World Development Indicators
Source organization:
International Monetary Fund, International Financial Statistics and data files, and World Bank and OECD GDP estimates.
Categories, topics:
Financial Sector, Private Sector
Last updated:
apr 23, 2017
Indicators value changes by year
At the date of observation
Value
Absolute change
Change from previous value
jan 1, 1961
1.115
+1.115
0.0%
jan 1, 1962
1.477
+0.363
32.52%
jan 1, 1963
1.669
+0.192
12.97%
jan 1, 1964
3.481
+1.812
108.56%
jan 1, 1965
4.319
+0.838
24.08%
jan 1, 1966
4.234
-0.084
-1.96%
jan 1, 1967
4.623
+0.388
9.17%
jan 1, 1968
4.65
+0.027
0.58%
jan 1, 1969
7.11
+2.46
52.92%
jan 1, 1970
7.598
+0.488
6.86%
jan 1, 1971
8.78
+1.182
15.56%
jan 1, 1972
9.115
+0.335
3.81%
jan 1, 1973
10.132
+1.017
11.16%
jan 1, 1974
10.995
+0.863
8.52%
jan 1, 1975
10.532
-0.463
-4.21%
jan 1, 1976
11.675
+1.144
10.86%
jan 1, 1977
13.665
+1.99
17.05%
jan 1, 1978
15.875
+2.209
16.17%
jan 1, 1979
17.315
+1.44
9.07%
jan 1, 1980
17.881
+0.566
3.27%
jan 1, 1981
17.089
-0.792
-4.43%
jan 1, 1982
16.665
-0.424
-2.48%
jan 1, 1983
27.085
+10.421
62.53%
jan 1, 1984
17.139
-9.946
-36.72%
jan 1, 1985
14.295
-2.844
-16.59%
jan 1, 1986
19.041
+4.746
33.2%
jan 1, 1987
12.826
-6.215
-32.64%
jan 1, 1988
15.399
+2.573
20.06%
jan 1, 1989
17.138
+1.74
11.3%
jan 1, 1990
20.712
+3.573
20.85%
jan 1, 1991
24.026
+3.314
16.0%
jan 1, 1992
28.66
+4.635
19.29%
jan 1, 1993
36.305
+7.644
26.67%
jan 1, 1994
45.498
+9.194
25.32%
jan 1, 1995
49.936
+4.438
9.75%
jan 1, 1996
48.202
-1.734
-3.47%
jan 1, 1997
52.737
+4.535
9.41%
jan 1, 1998
58.275
+5.538
10.5%
jan 1, 1999
64.052
+5.776
9.91%
jan 1, 2000
64.45
+0.398
0.62%
jan 1, 2001
58.722
-5.728
-8.89%
jan 1, 2002
53.557
-5.165
-8.8%
jan 1, 2003
51.002
-2.555
-4.77%
jan 1, 2004
47.881
-3.121
-6.12%
jan 1, 2005
42.651
-5.23
-10.92%
jan 1, 2006
45.025
+2.375
5.57%
jan 1, 2007
37.8
-7.225
-16.05%
jan 1, 2008
36.968
-0.832
-2.2%
jan 1, 2009
34.693
-2.276
-6.16%
jan 1, 2010
37.018
+2.326
6.7%
jan 1, 2011
40.342
+3.324
8.98%
jan 1, 2012
40.793
+0.451
1.12%
jan 1, 2013
44.137
+3.344
8.2%
jan 1, 2014
46.68
+2.543
5.76%
jan 1, 2015
50.322
+3.643
7.8%
jan 1, 2016
58.071
+7.748
15.4%
Ranking of countries by current statistics by years


Comments: