29
/
en
AIzaSyAYiBZKx7MnpbEhh9jyipgxe19OcubqV5w
April 1, 2024
104726
Chile
CHL
true
2
1
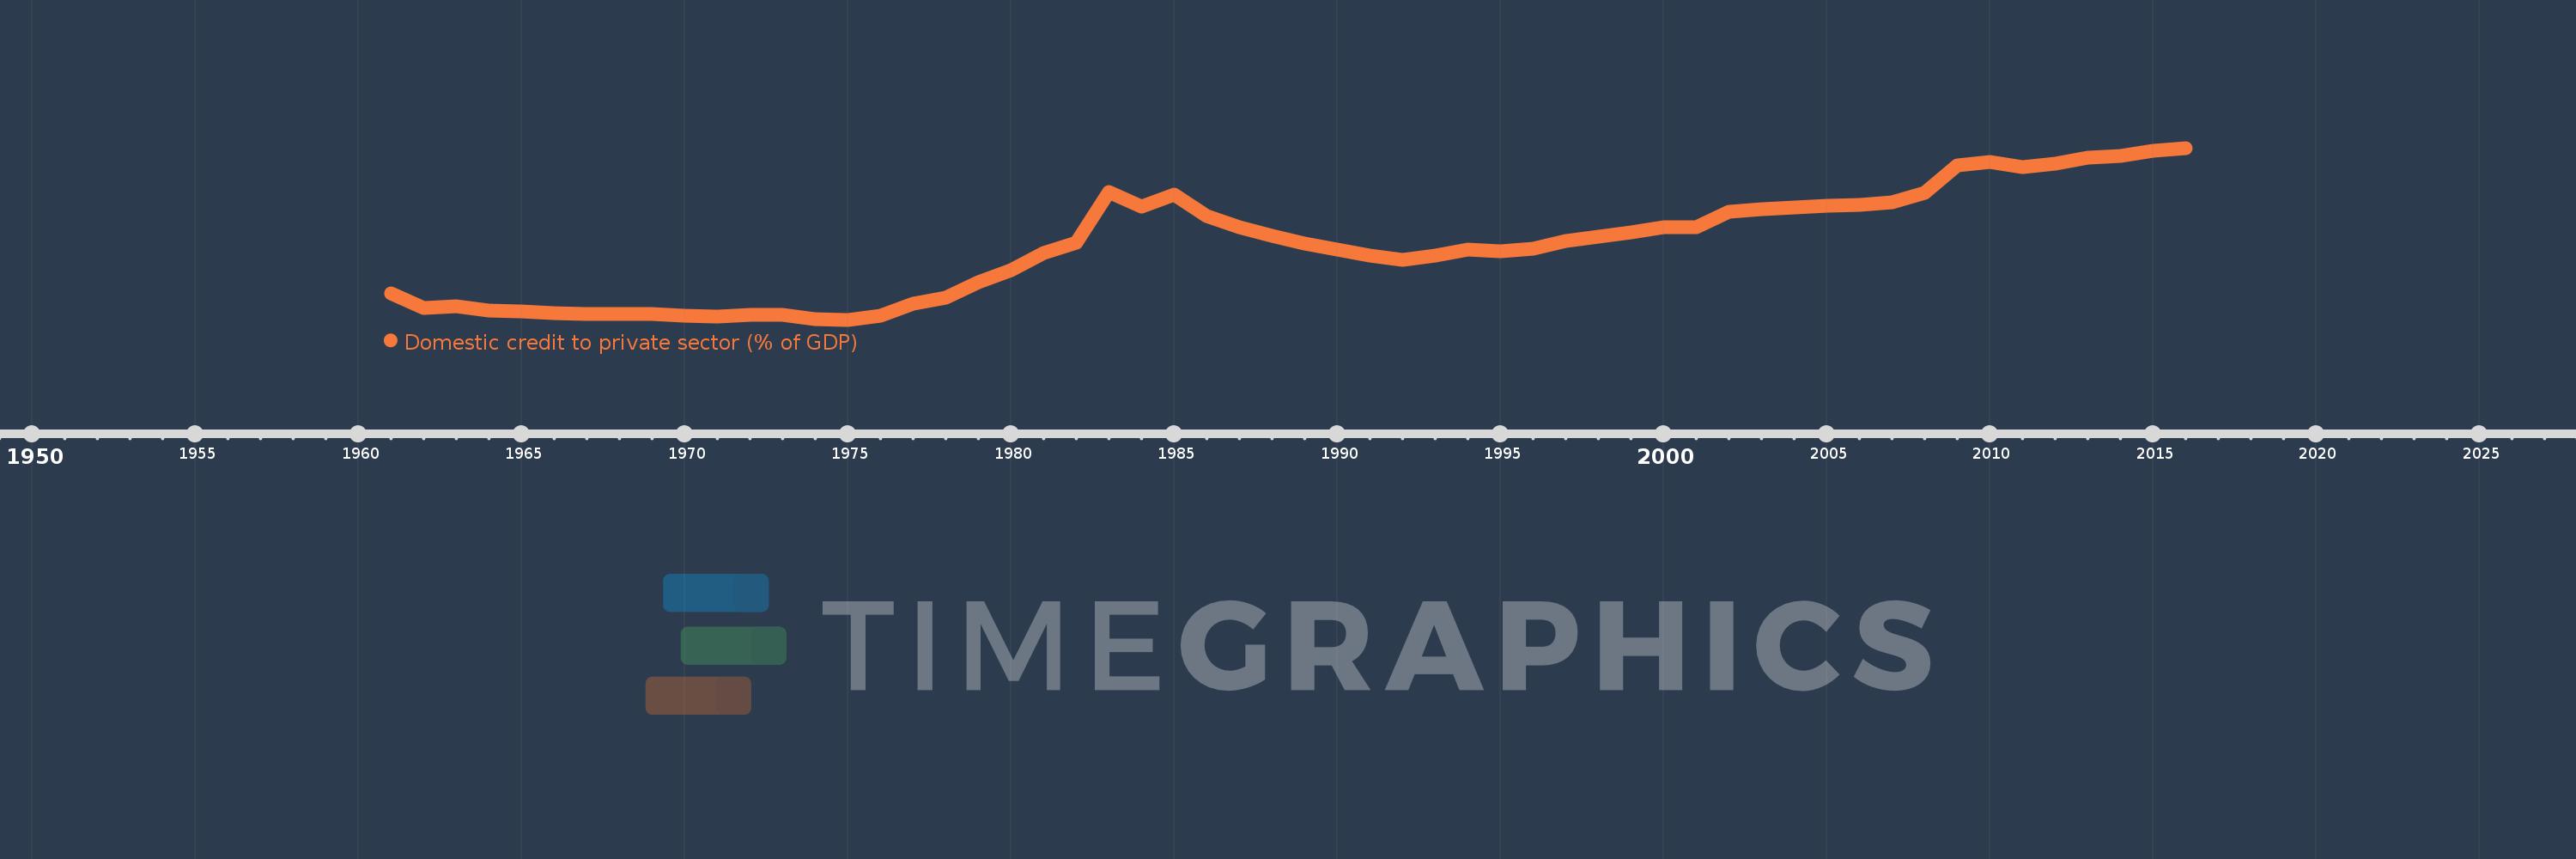
Domestic credit to private sector (% of GDP)
2016,2015,2014,2013,2012,2011,2010,2009,2008,2007,2006,2005,2004,2003,2002,2001,2000,1999,1998,1997,1996,1995,1994,1993,1992,1991,1990,1989,1988,1987,1986,1985,1984,1983,1982,1981,1980,1979,1978,1977,1976,1975,1974,1973,1972,1971,1970,1969,1968,1967,1966,1965,1964,1963,1962,1961
This statistics in other country:
AfghanistanAlbaniaAlgeriaAngolaAntigua and BarbudaArab WorldArgentinaArmeniaArubaAustraliaAustriaAzerbaijanBahamas, TheBahrainBangladeshBarbadosBelarusBelgiumBelizeBeninBhutanBoliviaBosnia and HerzegovinaBotswanaBrazilBrunei DarussalamBulgariaBurkina FasoBurundiCabo VerdeCambodiaCameroonCanadaCaribbean small statesCentral African RepublicCentral Europe and the BalticsChadChileChinaColombiaComorosCongo, Dem. Rep.Congo, Rep.Costa RicaCote d'IvoireCroatiaCyprusCzech RepublicDenmarkDjiboutiDominicaDominican RepublicEarly-demographic dividendEast Asia & PacificEast Asia & Pacific (excluding high income)East Asia & Pacific (IDA & IBRD countries)EcuadorEgypt, Arab Rep.El SalvadorEquatorial GuineaEritreaEstoniaEthiopiaEuro areaEurope & Central AsiaEurope & Central Asia (excluding high income)Europe & Central Asia (IDA & IBRD countries)European UnionFijiFinlandFragile and conflict affected situationsFranceGabonGambia, TheGeorgiaGermanyGhanaGreeceGrenadaGuatemalaGuineaGuinea-BissauGuyanaHaitiHeavily indebted poor countries (HIPC)High incomeHondurasHong Kong SAR, ChinaHungaryIBRD onlyIcelandIDA & IBRD totalIDA blendIDA onlyIDA totalIndiaIndonesiaIran, Islamic Rep.IraqIrelandIsraelItalyJamaicaJapanJordanKazakhstanKenyaKorea, Rep.KosovoKuwaitKyrgyz RepublicLao PDRLate-demographic dividendLatin America & Caribbean Latin America & Caribbean (excluding high income)Latin America & the Caribbean (IDA & IBRD countries)LatviaLeast developed countries: UN classificationLebanonLesothoLiberiaLibyaLithuaniaLow & middle incomeLow incomeLower middle incomeLuxembourgMacao SAR, ChinaMacedonia, FYRMadagascarMalawiMalaysiaMaldivesMaliMaltaMauritaniaMauritiusMexicoMicronesia, Fed. Sts.Middle East & North AfricaMiddle East & North Africa (excluding high income)Middle East & North Africa (IDA & IBRD countries)Middle incomeMoldovaMongoliaMontenegroMoroccoMozambiqueMyanmarNamibiaNepalNetherlandsNew ZealandNicaraguaNigerNigeriaNorth AmericaNorwayOECD membersOmanOther small statesPacific island small statesPakistanPanamaPapua New GuineaParaguayPeruPhilippinesPolandPortugalPost-demographic dividendPre-demographic dividendQatarRomaniaRussian FederationRwandaSamoaSao Tome and PrincipeSaudi ArabiaSenegalSerbiaSeychellesSierra LeoneSingaporeSlovak RepublicSloveniaSmall statesSolomon IslandsSouth AfricaSouth AsiaSouth Asia (IDA & IBRD)South SudanSpainSri LankaSt. Kitts and NevisSt. LuciaSt. Vincent and the GrenadinesSub-Saharan Africa Sub-Saharan Africa (excluding high income)Sub-Saharan Africa (IDA & IBRD countries)SudanSurinameSwazilandSwedenSwitzerlandSyrian Arab RepublicTajikistanTanzaniaThailandTimor-LesteTogoTongaTrinidad and TobagoTunisiaTurkeyUgandaUkraineUnited Arab EmiratesUnited KingdomUnited StatesUpper middle incomeUruguayVanuatuVenezuela, RBVietnamWest Bank and GazaWorldYemen, Rep.ZambiaZimbabwe Timeline:
This timeline shows a graph from 1961 to 2016 of Chile. No data until 1960. Number of actual observations by date: 56.
Source name:
World Development Indicators
Source organization:
International Monetary Fund, International Financial Statistics and data files, and World Bank and OECD GDP estimates.
Categories, topics:
Financial Sector, Private Sector
Last updated:
apr 23, 2017
Indicators value changes by year
Maximum:
110.955
jan 1, 2016
At the date of observation
Value
Absolute change
Change from previous value
jan 1, 1961
22.443
+22.443
0.0%
jan 1, 1962
13.326
-9.117
-40.62%
jan 1, 1963
14.562
+1.236
9.27%
jan 1, 1964
12.03
-2.531
-17.38%
jan 1, 1965
11.312
-0.719
-5.97%
jan 1, 1966
10.455
-0.857
-7.57%
jan 1, 1967
9.937
-0.518
-4.96%
jan 1, 1968
9.94
+0.003
0.03%
jan 1, 1969
9.76
-0.181
-1.82%
jan 1, 1970
8.654
-1.106
-11.33%
jan 1, 1971
8.087
-0.566
-6.54%
jan 1, 1972
9.106
+1.019
12.6%
jan 1, 1973
9.489
+0.383
4.2%
jan 1, 1974
6.533
-2.956
-31.15%
jan 1, 1975
6.325
-0.208
-3.19%
jan 1, 1976
8.66
+2.335
36.93%
jan 1, 1977
16.105
+7.445
85.97%
jan 1, 1978
20.017
+3.912
24.29%
jan 1, 1979
28.948
+8.931
44.62%
jan 1, 1980
36.251
+7.302
25.23%
jan 1, 1981
46.853
+10.603
29.25%
jan 1, 1982
53.152
+6.298
13.44%
jan 1, 1983
84.091
+30.939
58.21%
jan 1, 1984
75.299
-8.791
-10.45%
jan 1, 1985
82.398
+7.098
9.43%
jan 1, 1986
69.324
-13.074
-15.87%
jan 1, 1987
62.699
-6.625
-9.56%
jan 1, 1988
57.409
-5.29
-8.44%
jan 1, 1989
52.629
-4.78
-8.33%
jan 1, 1990
48.865
-3.763
-7.15%
jan 1, 1991
45.306
-3.559
-7.28%
jan 1, 1992
42.643
-2.663
-5.88%
jan 1, 1993
45.206
+2.563
6.01%
jan 1, 1994
49.239
+4.034
8.92%
jan 1, 1995
48.074
-1.165
-2.37%
jan 1, 1996
49.709
+1.635
3.4%
jan 1, 1997
54.102
+4.392
8.84%
jan 1, 1998
57.121
+3.019
5.58%
jan 1, 1999
59.568
+2.447
4.28%
jan 1, 2000
62.532
+2.965
4.98%
jan 1, 2001
62.52
-0.013
-0.02%
jan 1, 2002
72.253
+9.734
15.57%
jan 1, 2003
73.624
+1.37
1.9%
jan 1, 2004
74.534
+0.91
1.24%
jan 1, 2005
75.567
+1.033
1.39%
jan 1, 2006
76.331
+0.764
1.01%
jan 1, 2007
77.694
+1.363
1.79%
jan 1, 2008
83.825
+6.131
7.89%
jan 1, 2009
100.14
+16.315
19.46%
jan 1, 2010
102.372
+2.232
2.23%
jan 1, 2011
99.265
-3.107
-3.03%
jan 1, 2012
101.617
+2.352
2.37%
jan 1, 2013
104.817
+3.2
3.15%
jan 1, 2014
105.873
+1.056
1.01%
jan 1, 2015
109.164
+3.291
3.11%
jan 1, 2016
110.955
+1.791
1.64%
Ranking of countries by current statistics by years


Comments: