29
/
en
AIzaSyAYiBZKx7MnpbEhh9jyipgxe19OcubqV5w
April 1, 2024
34154
Fragile and conflict affected situations
FCS
false
2
1
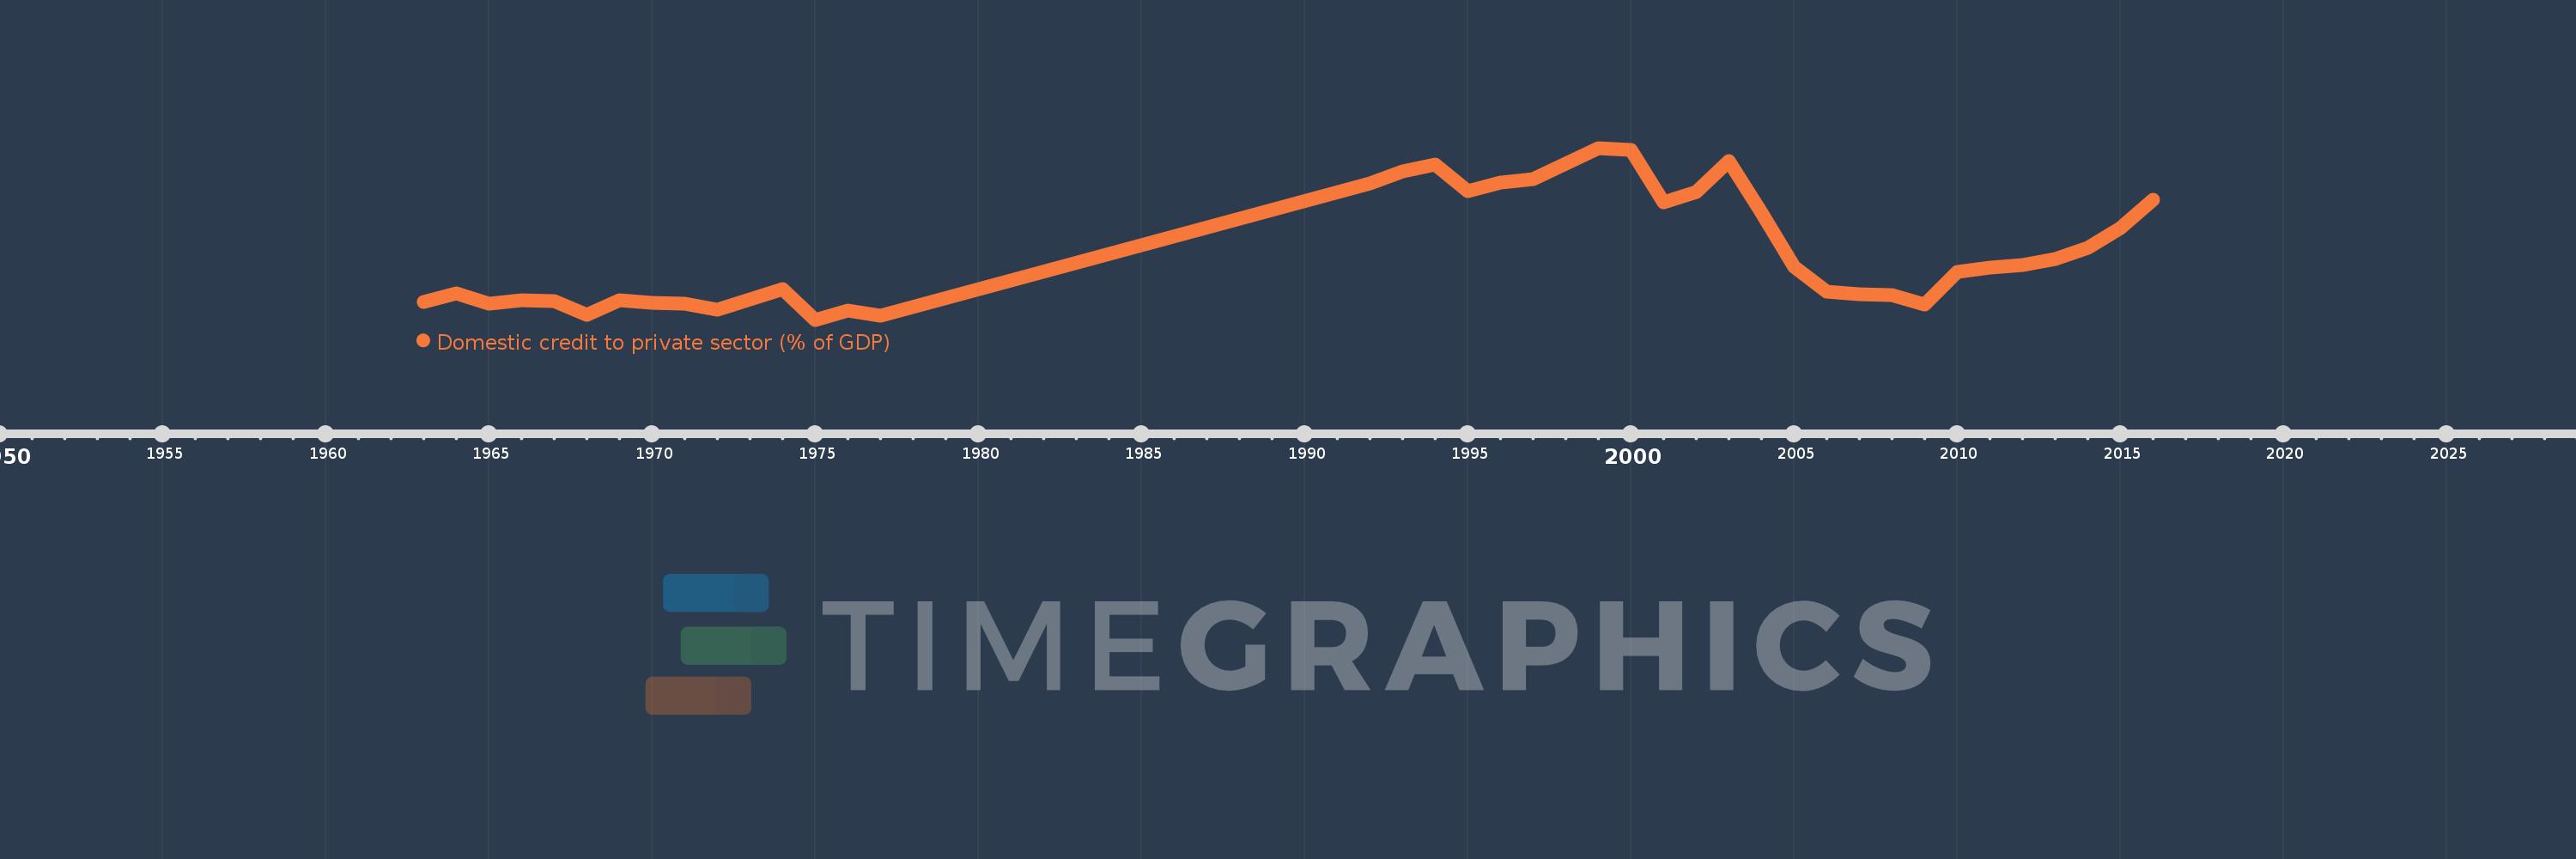
Domestic credit to private sector (% of GDP)
2016,2015,2014,2013,2012,2011,2010,2009,2008,2007,2006,2005,2004,2003,2002,2001,2000,1999,1998,1997,1996,1995,1994,1993,1992,1977,1976,1975,1974,1973,1972,1971,1970,1969,1968,1967,1966,1965,1964,1963
This statistics in other country:
AfghanistanAlbaniaAlgeriaAngolaAntigua and BarbudaArab WorldArgentinaArmeniaArubaAustraliaAustriaAzerbaijanBahamas, TheBahrainBangladeshBarbadosBelarusBelgiumBelizeBeninBhutanBoliviaBosnia and HerzegovinaBotswanaBrazilBrunei DarussalamBulgariaBurkina FasoBurundiCabo VerdeCambodiaCameroonCanadaCaribbean small statesCentral African RepublicCentral Europe and the BalticsChadChileChinaColombiaComorosCongo, Dem. Rep.Congo, Rep.Costa RicaCote d'IvoireCroatiaCyprusCzech RepublicDenmarkDjiboutiDominicaDominican RepublicEarly-demographic dividendEast Asia & PacificEast Asia & Pacific (excluding high income)East Asia & Pacific (IDA & IBRD countries)EcuadorEgypt, Arab Rep.El SalvadorEquatorial GuineaEritreaEstoniaEthiopiaEuro areaEurope & Central AsiaEurope & Central Asia (excluding high income)Europe & Central Asia (IDA & IBRD countries)European UnionFijiFinlandFragile and conflict affected situationsFranceGabonGambia, TheGeorgiaGermanyGhanaGreeceGrenadaGuatemalaGuineaGuinea-BissauGuyanaHaitiHeavily indebted poor countries (HIPC)High incomeHondurasHong Kong SAR, ChinaHungaryIBRD onlyIcelandIDA & IBRD totalIDA blendIDA onlyIDA totalIndiaIndonesiaIran, Islamic Rep.IraqIrelandIsraelItalyJamaicaJapanJordanKazakhstanKenyaKorea, Rep.KosovoKuwaitKyrgyz RepublicLao PDRLate-demographic dividendLatin America & Caribbean Latin America & Caribbean (excluding high income)Latin America & the Caribbean (IDA & IBRD countries)LatviaLeast developed countries: UN classificationLebanonLesothoLiberiaLibyaLithuaniaLow & middle incomeLow incomeLower middle incomeLuxembourgMacao SAR, ChinaMacedonia, FYRMadagascarMalawiMalaysiaMaldivesMaliMaltaMauritaniaMauritiusMexicoMicronesia, Fed. Sts.Middle East & North AfricaMiddle East & North Africa (excluding high income)Middle East & North Africa (IDA & IBRD countries)Middle incomeMoldovaMongoliaMontenegroMoroccoMozambiqueMyanmarNamibiaNepalNetherlandsNew ZealandNicaraguaNigerNigeriaNorth AmericaNorwayOECD membersOmanOther small statesPacific island small statesPakistanPanamaPapua New GuineaParaguayPeruPhilippinesPolandPortugalPost-demographic dividendPre-demographic dividendQatarRomaniaRussian FederationRwandaSamoaSao Tome and PrincipeSaudi ArabiaSenegalSerbiaSeychellesSierra LeoneSingaporeSlovak RepublicSloveniaSmall statesSolomon IslandsSouth AfricaSouth AsiaSouth Asia (IDA & IBRD)South SudanSpainSri LankaSt. Kitts and NevisSt. LuciaSt. Vincent and the GrenadinesSub-Saharan Africa Sub-Saharan Africa (excluding high income)Sub-Saharan Africa (IDA & IBRD countries)SudanSurinameSwazilandSwedenSwitzerlandSyrian Arab RepublicTajikistanTanzaniaThailandTimor-LesteTogoTongaTrinidad and TobagoTunisiaTurkeyUgandaUkraineUnited Arab EmiratesUnited KingdomUnited StatesUpper middle incomeUruguayVanuatuVenezuela, RBVietnamWest Bank and GazaWorldYemen, Rep.ZambiaZimbabwe Timeline:
This timeline shows a graph from 1963 to 2016 of Fragile and conflict affected situations. No data until 1962. Number of actual observations by date: 40.
Source name:
World Development Indicators
Source organization:
International Monetary Fund, International Financial Statistics and data files, and World Bank and OECD GDP estimates.
Categories, topics:
Financial Sector, Private Sector
Last updated:
apr 23, 2017
Indicators value changes by year
Minimum:
10.405
jan 1, 1975
Maximum:
23.585
jan 1, 1999
At the date of observation
Value
Absolute change
Change from previous value
jan 1, 1963
11.752
+11.752
0.0%
jan 1, 1964
12.427
+0.675
5.75%
jan 1, 1965
11.664
-0.764
-6.14%
jan 1, 1966
11.905
+0.242
2.07%
jan 1, 1967
11.851
-0.054
-0.45%
jan 1, 1968
10.767
-1.085
-9.15%
jan 1, 1969
11.926
+1.16
10.77%
jan 1, 1970
11.705
-0.222
-1.86%
jan 1, 1971
11.657
-0.047
-0.41%
jan 1, 1972
11.155
-0.502
-4.31%
jan 1, 1973
11.942
+0.788
7.06%
jan 1, 1974
12.738
+0.796
6.66%
jan 1, 1975
10.405
-2.333
-18.32%
jan 1, 1976
11.097
+0.692
6.65%
jan 1, 1977
10.723
-0.373
-3.36%
jan 1, 1992
20.841
+10.117
94.35%
jan 1, 1993
21.816
+0.975
4.68%
jan 1, 1994
22.3
+0.484
2.22%
jan 1, 1995
20.276
-2.024
-9.08%
jan 1, 1996
20.96
+0.684
3.38%
jan 1, 1997
21.166
+0.205
0.98%
jan 1, 1998
22.393
+1.228
5.8%
jan 1, 1999
23.585
+1.192
5.32%
jan 1, 2000
23.403
-0.183
-0.77%
jan 1, 2001
19.42
-3.983
-17.02%
jan 1, 2002
20.178
+0.758
3.9%
jan 1, 2003
22.581
+2.402
11.91%
jan 1, 2004
18.593
-3.987
-17.66%
jan 1, 2005
14.46
-4.134
-22.23%
jan 1, 2006
12.577
-1.882
-13.02%
jan 1, 2007
12.366
-0.211
-1.68%
jan 1, 2008
12.266
-0.1
-0.81%
jan 1, 2009
11.576
-0.69
-5.62%
jan 1, 2010
14.094
+2.518
21.75%
jan 1, 2011
14.437
+0.343
2.43%
jan 1, 2012
14.623
+0.185
1.28%
jan 1, 2013
15.049
+0.426
2.91%
jan 1, 2014
15.94
+0.891
5.92%
jan 1, 2015
17.414
+1.474
9.24%
jan 1, 2016
19.605
+2.192
12.59%
Ranking of countries by current statistics by years


Comments: