29
/
en
AIzaSyAYiBZKx7MnpbEhh9jyipgxe19OcubqV5w
April 1, 2024
44169
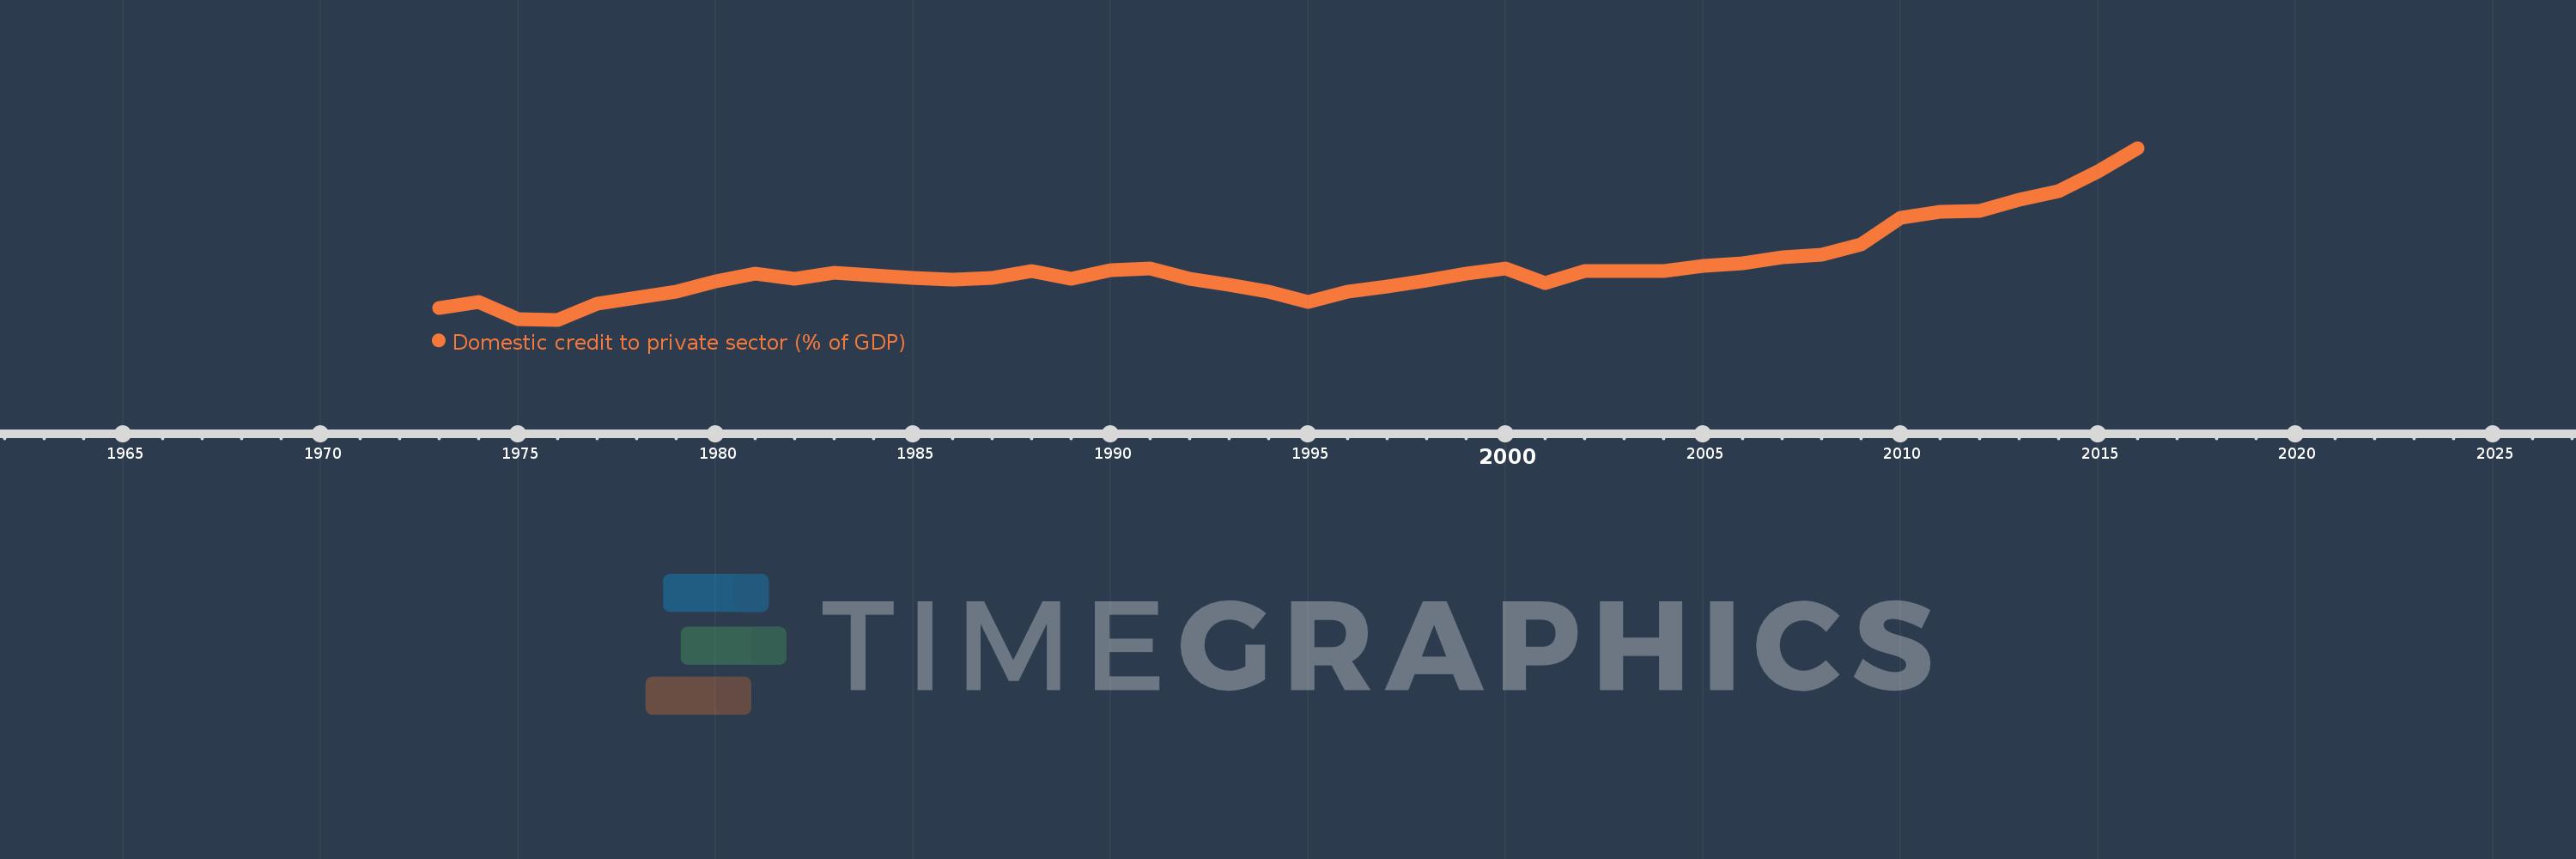
Least developed countries: UN classification
LDC
false
2
1
Domestic credit to private sector (% of GDP)
2016,2015,2014,2013,2012,2011,2010,2009,2008,2007,2006,2005,2004,2003,2002,2001,2000,1999,1998,1997,1996,1995,1994,1993,1992,1991,1990,1989,1988,1987,1986,1985,1984,1983,1982,1981,1980,1979,1978,1977,1976,1975,1974,1973
This statistics in other country:
AfghanistanAlbaniaAlgeriaAngolaAntigua and BarbudaArab WorldArgentinaArmeniaArubaAustraliaAustriaAzerbaijanBahamas, TheBahrainBangladeshBarbadosBelarusBelgiumBelizeBeninBhutanBoliviaBosnia and HerzegovinaBotswanaBrazilBrunei DarussalamBulgariaBurkina FasoBurundiCabo VerdeCambodiaCameroonCanadaCaribbean small statesCentral African RepublicCentral Europe and the BalticsChadChileChinaColombiaComorosCongo, Dem. Rep.Congo, Rep.Costa RicaCote d'IvoireCroatiaCyprusCzech RepublicDenmarkDjiboutiDominicaDominican RepublicEarly-demographic dividendEast Asia & PacificEast Asia & Pacific (excluding high income)East Asia & Pacific (IDA & IBRD countries)EcuadorEgypt, Arab Rep.El SalvadorEquatorial GuineaEritreaEstoniaEthiopiaEuro areaEurope & Central AsiaEurope & Central Asia (excluding high income)Europe & Central Asia (IDA & IBRD countries)European UnionFijiFinlandFragile and conflict affected situationsFranceGabonGambia, TheGeorgiaGermanyGhanaGreeceGrenadaGuatemalaGuineaGuinea-BissauGuyanaHaitiHeavily indebted poor countries (HIPC)High incomeHondurasHong Kong SAR, ChinaHungaryIBRD onlyIcelandIDA & IBRD totalIDA blendIDA onlyIDA totalIndiaIndonesiaIran, Islamic Rep.IraqIrelandIsraelItalyJamaicaJapanJordanKazakhstanKenyaKorea, Rep.KosovoKuwaitKyrgyz RepublicLao PDRLate-demographic dividendLatin America & Caribbean Latin America & Caribbean (excluding high income)Latin America & the Caribbean (IDA & IBRD countries)LatviaLeast developed countries: UN classificationLebanonLesothoLiberiaLibyaLithuaniaLow & middle incomeLow incomeLower middle incomeLuxembourgMacao SAR, ChinaMacedonia, FYRMadagascarMalawiMalaysiaMaldivesMaliMaltaMauritaniaMauritiusMexicoMicronesia, Fed. Sts.Middle East & North AfricaMiddle East & North Africa (excluding high income)Middle East & North Africa (IDA & IBRD countries)Middle incomeMoldovaMongoliaMontenegroMoroccoMozambiqueMyanmarNamibiaNepalNetherlandsNew ZealandNicaraguaNigerNigeriaNorth AmericaNorwayOECD membersOmanOther small statesPacific island small statesPakistanPanamaPapua New GuineaParaguayPeruPhilippinesPolandPortugalPost-demographic dividendPre-demographic dividendQatarRomaniaRussian FederationRwandaSamoaSao Tome and PrincipeSaudi ArabiaSenegalSerbiaSeychellesSierra LeoneSingaporeSlovak RepublicSloveniaSmall statesSolomon IslandsSouth AfricaSouth AsiaSouth Asia (IDA & IBRD)South SudanSpainSri LankaSt. Kitts and NevisSt. LuciaSt. Vincent and the GrenadinesSub-Saharan Africa Sub-Saharan Africa (excluding high income)Sub-Saharan Africa (IDA & IBRD countries)SudanSurinameSwazilandSwedenSwitzerlandSyrian Arab RepublicTajikistanTanzaniaThailandTimor-LesteTogoTongaTrinidad and TobagoTunisiaTurkeyUgandaUkraineUnited Arab EmiratesUnited KingdomUnited StatesUpper middle incomeUruguayVanuatuVenezuela, RBVietnamWest Bank and GazaWorldYemen, Rep.ZambiaZimbabwe Timeline:
This timeline shows a graph from 1973 to 2016 of Least developed countries: UN classification. No data until 1972. Number of actual observations by date: 44.
Source name:
World Development Indicators
Source organization:
International Monetary Fund, International Financial Statistics and data files, and World Bank and OECD GDP estimates.
Categories, topics:
Financial Sector, Private Sector
Last updated:
apr 23, 2017
Indicators value changes by year
Maximum:
25.852
jan 1, 2016
At the date of observation
Value
Absolute change
Change from previous value
jan 1, 1973
9.637
+9.637
0.0%
jan 1, 1974
10.233
+0.596
6.18%
jan 1, 1975
8.515
-1.718
-16.79%
jan 1, 1976
8.446
-0.069
-0.81%
jan 1, 1977
10.039
+1.593
18.86%
jan 1, 1978
10.665
+0.626
6.23%
jan 1, 1979
11.267
+0.603
5.65%
jan 1, 1980
12.341
+1.074
9.53%
jan 1, 1981
13.087
+0.745
6.04%
jan 1, 1982
12.6
-0.487
-3.72%
jan 1, 1983
13.226
+0.626
4.97%
jan 1, 1984
12.946
-0.28
-2.12%
jan 1, 1985
12.684
-0.262
-2.02%
jan 1, 1986
12.49
-0.194
-1.53%
jan 1, 1987
12.657
+0.167
1.34%
jan 1, 1988
13.417
+0.759
6.0%
jan 1, 1989
12.632
-0.785
-5.85%
jan 1, 1990
13.494
+0.862
6.82%
jan 1, 1991
13.646
+0.152
1.13%
jan 1, 1992
12.622
-1.025
-7.51%
jan 1, 1993
12.026
-0.596
-4.72%
jan 1, 1994
11.252
-0.774
-6.44%
jan 1, 1995
10.24
-1.012
-8.99%
jan 1, 1996
11.289
+1.049
10.24%
jan 1, 1997
11.812
+0.523
4.63%
jan 1, 1998
12.417
+0.606
5.13%
jan 1, 1999
13.094
+0.677
5.45%
jan 1, 2000
13.629
+0.535
4.08%
jan 1, 2001
12.127
-1.502
-11.02%
jan 1, 2002
13.338
+1.211
9.99%
jan 1, 2003
13.371
+0.033
0.25%
jan 1, 2004
13.364
-0.008
-0.06%
jan 1, 2005
13.901
+0.538
4.02%
jan 1, 2006
14.16
+0.259
1.86%
jan 1, 2007
14.755
+0.595
4.2%
jan 1, 2008
15.064
+0.309
2.1%
jan 1, 2009
16.111
+1.047
6.95%
jan 1, 2010
18.772
+2.661
16.52%
jan 1, 2011
19.412
+0.639
3.41%
jan 1, 2012
19.459
+0.047
0.24%
jan 1, 2013
20.624
+1.165
5.99%
jan 1, 2014
21.461
+0.837
4.06%
jan 1, 2015
23.48
+2.019
9.41%
jan 1, 2016
25.852
+2.372
10.1%
Ranking of countries by current statistics by years


Comments: