29
/
en
AIzaSyAYiBZKx7MnpbEhh9jyipgxe19OcubqV5w
April 1, 2024
275552
United Kingdom
GBR
true
2
1
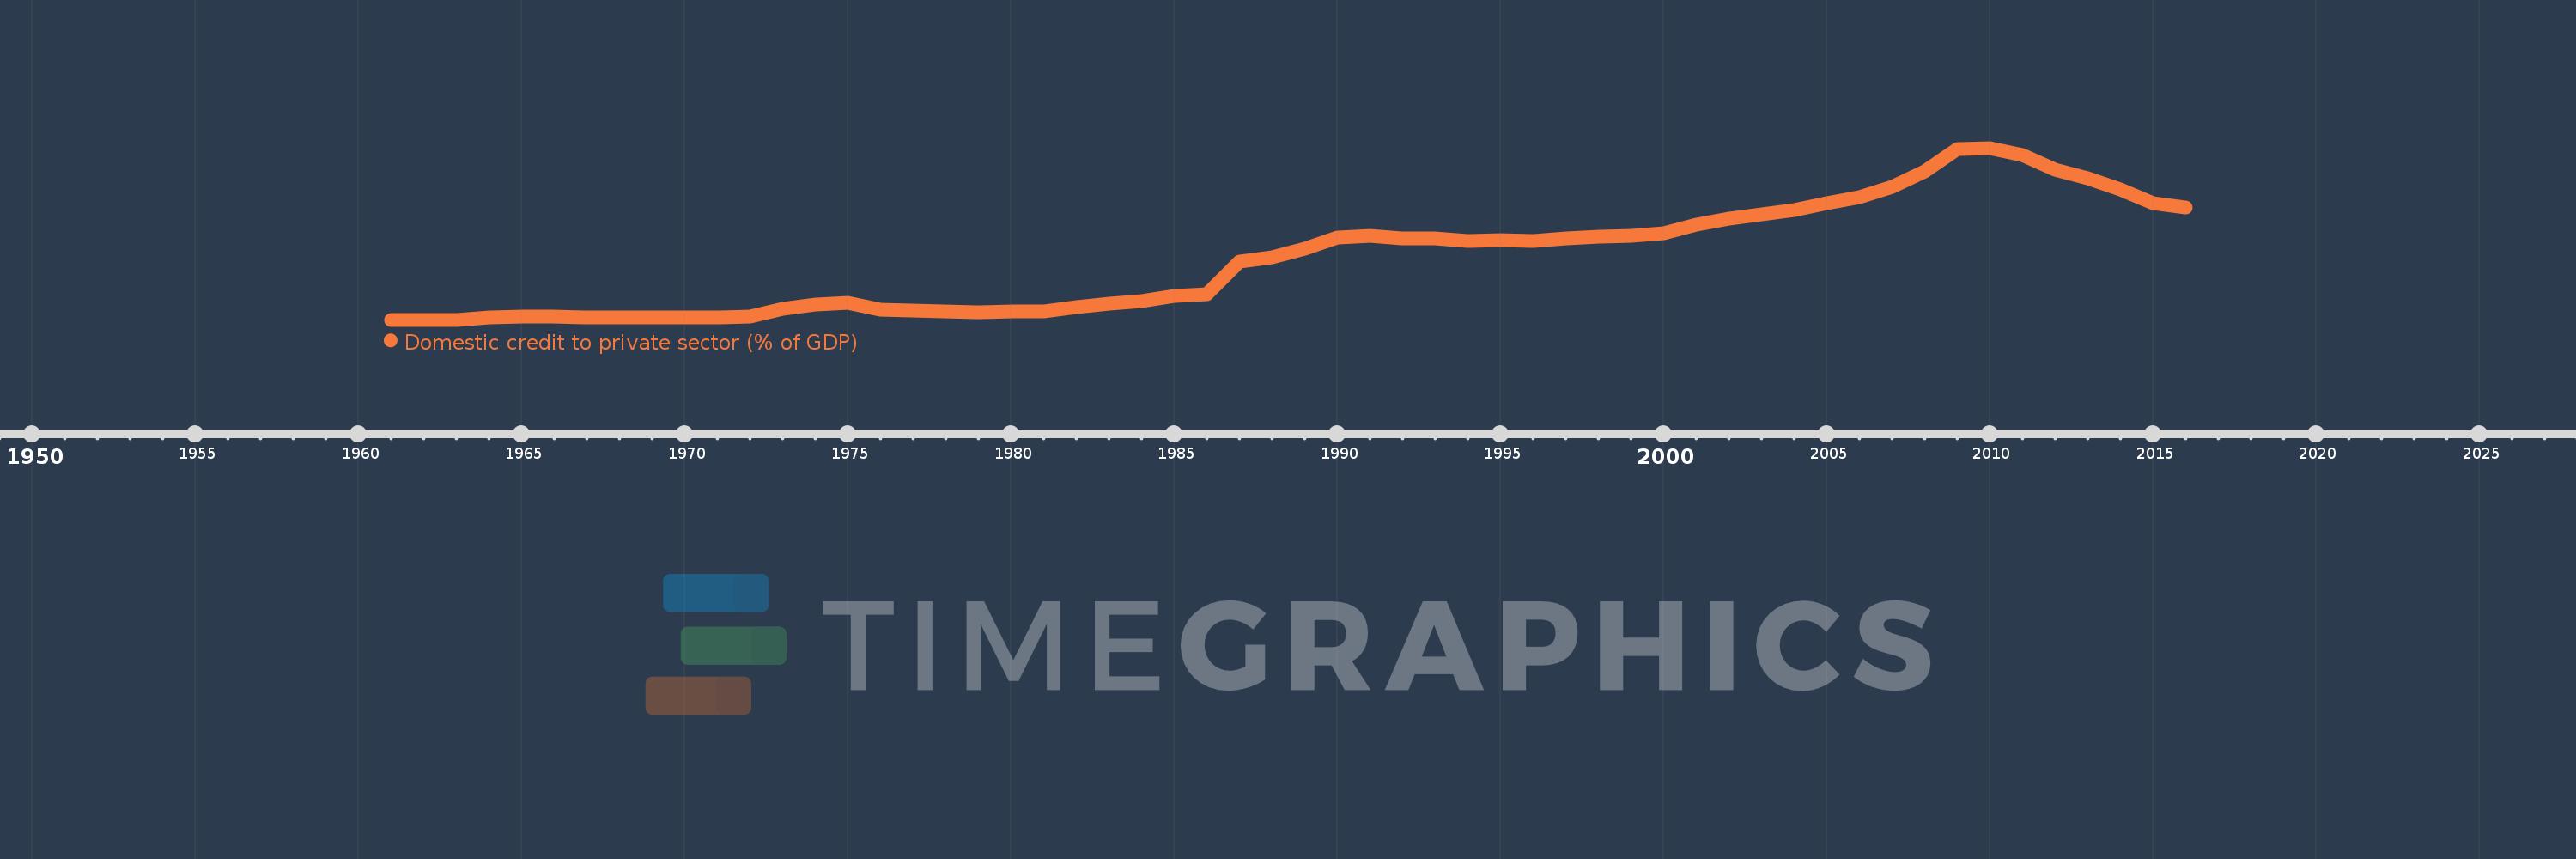
Domestic credit to private sector (% of GDP)
2016,2015,2014,2013,2012,2011,2010,2009,2008,2007,2006,2005,2004,2003,2002,2001,2000,1999,1998,1997,1996,1995,1994,1993,1992,1991,1990,1989,1988,1987,1986,1985,1984,1983,1982,1981,1980,1979,1978,1977,1976,1975,1974,1973,1972,1971,1970,1969,1968,1967,1966,1965,1964,1963,1962,1961
This statistics in other country:
AfghanistanAlbaniaAlgeriaAngolaAntigua and BarbudaArab WorldArgentinaArmeniaArubaAustraliaAustriaAzerbaijanBahamas, TheBahrainBangladeshBarbadosBelarusBelgiumBelizeBeninBhutanBoliviaBosnia and HerzegovinaBotswanaBrazilBrunei DarussalamBulgariaBurkina FasoBurundiCabo VerdeCambodiaCameroonCanadaCaribbean small statesCentral African RepublicCentral Europe and the BalticsChadChileChinaColombiaComorosCongo, Dem. Rep.Congo, Rep.Costa RicaCote d'IvoireCroatiaCyprusCzech RepublicDenmarkDjiboutiDominicaDominican RepublicEarly-demographic dividendEast Asia & PacificEast Asia & Pacific (excluding high income)East Asia & Pacific (IDA & IBRD countries)EcuadorEgypt, Arab Rep.El SalvadorEquatorial GuineaEritreaEstoniaEthiopiaEuro areaEurope & Central AsiaEurope & Central Asia (excluding high income)Europe & Central Asia (IDA & IBRD countries)European UnionFijiFinlandFragile and conflict affected situationsFranceGabonGambia, TheGeorgiaGermanyGhanaGreeceGrenadaGuatemalaGuineaGuinea-BissauGuyanaHaitiHeavily indebted poor countries (HIPC)High incomeHondurasHong Kong SAR, ChinaHungaryIBRD onlyIcelandIDA & IBRD totalIDA blendIDA onlyIDA totalIndiaIndonesiaIran, Islamic Rep.IraqIrelandIsraelItalyJamaicaJapanJordanKazakhstanKenyaKorea, Rep.KosovoKuwaitKyrgyz RepublicLao PDRLate-demographic dividendLatin America & Caribbean Latin America & Caribbean (excluding high income)Latin America & the Caribbean (IDA & IBRD countries)LatviaLeast developed countries: UN classificationLebanonLesothoLiberiaLibyaLithuaniaLow & middle incomeLow incomeLower middle incomeLuxembourgMacao SAR, ChinaMacedonia, FYRMadagascarMalawiMalaysiaMaldivesMaliMaltaMauritaniaMauritiusMexicoMicronesia, Fed. Sts.Middle East & North AfricaMiddle East & North Africa (excluding high income)Middle East & North Africa (IDA & IBRD countries)Middle incomeMoldovaMongoliaMontenegroMoroccoMozambiqueMyanmarNamibiaNepalNetherlandsNew ZealandNicaraguaNigerNigeriaNorth AmericaNorwayOECD membersOmanOther small statesPacific island small statesPakistanPanamaPapua New GuineaParaguayPeruPhilippinesPolandPortugalPost-demographic dividendPre-demographic dividendQatarRomaniaRussian FederationRwandaSamoaSao Tome and PrincipeSaudi ArabiaSenegalSerbiaSeychellesSierra LeoneSingaporeSlovak RepublicSloveniaSmall statesSolomon IslandsSouth AfricaSouth AsiaSouth Asia (IDA & IBRD)South SudanSpainSri LankaSt. Kitts and NevisSt. LuciaSt. Vincent and the GrenadinesSub-Saharan Africa Sub-Saharan Africa (excluding high income)Sub-Saharan Africa (IDA & IBRD countries)SudanSurinameSwazilandSwedenSwitzerlandSyrian Arab RepublicTajikistanTanzaniaThailandTimor-LesteTogoTongaTrinidad and TobagoTunisiaTurkeyUgandaUkraineUnited Arab EmiratesUnited KingdomUnited StatesUpper middle incomeUruguayVanuatuVenezuela, RBVietnamWest Bank and GazaWorldYemen, Rep.ZambiaZimbabwe Timeline:
This timeline shows a graph from 1961 to 2016 of United Kingdom. No data until 1960. Number of actual observations by date: 56.
Source name:
World Development Indicators
Source organization:
International Monetary Fund, International Financial Statistics and data files, and World Bank and OECD GDP estimates.
Categories, topics:
Financial Sector, Private Sector
Last updated:
apr 23, 2017
Indicators value changes by year
Minimum:
17.556
jan 1, 1961
Maximum:
196.155
jan 1, 2010
At the date of observation
Value
Absolute change
Change from previous value
jan 1, 1961
17.556
+17.556
0.0%
jan 1, 1962
17.732
+0.176
1.0%
jan 1, 1963
17.578
-0.154
-0.87%
jan 1, 1964
19.597
+2.019
11.48%
jan 1, 1965
20.898
+1.301
6.64%
jan 1, 1966
20.876
-0.022
-0.11%
jan 1, 1967
19.766
-1.109
-5.31%
jan 1, 1968
20.169
+0.402
2.03%
jan 1, 1969
20.286
+0.117
0.58%
jan 1, 1970
20.001
-0.285
-1.41%
jan 1, 1971
19.816
-0.185
-0.92%
jan 1, 1972
20.753
+0.937
4.73%
jan 1, 1973
28.551
+7.798
37.58%
jan 1, 1974
33.565
+5.014
17.56%
jan 1, 1975
35.2
+1.635
4.87%
jan 1, 1976
28.314
-6.885
-19.56%
jan 1, 1977
27.362
-0.952
-3.36%
jan 1, 1978
26.085
-1.277
-4.67%
jan 1, 1979
25.599
-0.486
-1.86%
jan 1, 1980
25.862
+0.263
1.03%
jan 1, 1981
26.216
+0.354
1.37%
jan 1, 1982
30.86
+4.644
17.72%
jan 1, 1983
34.049
+3.188
10.33%
jan 1, 1984
37.072
+3.024
8.88%
jan 1, 1985
42.236
+5.163
13.93%
jan 1, 1986
43.906
+1.671
3.96%
jan 1, 1987
77.611
+33.704
76.76%
jan 1, 1988
82.771
+5.16
6.65%
jan 1, 1989
91.575
+8.804
10.64%
jan 1, 1990
102.93
+11.355
12.4%
jan 1, 1991
104.806
+1.876
1.82%
jan 1, 1992
102.334
-2.472
-2.36%
jan 1, 1993
101.678
-0.656
-0.64%
jan 1, 1994
99.876
-1.802
-1.77%
jan 1, 1995
100.031
+0.155
0.15%
jan 1, 1996
99.102
-0.929
-0.93%
jan 1, 1997
102.127
+3.025
3.05%
jan 1, 1998
103.641
+1.514
1.48%
jan 1, 1999
104.424
+0.783
0.76%
jan 1, 2000
107.739
+3.315
3.17%
jan 1, 2001
116.821
+9.082
8.43%
jan 1, 2002
122.528
+5.707
4.89%
jan 1, 2003
126.869
+4.341
3.54%
jan 1, 2004
131.302
+4.432
3.49%
jan 1, 2005
138.999
+7.698
5.86%
jan 1, 2006
145.125
+6.126
4.41%
jan 1, 2007
155.837
+10.712
7.38%
jan 1, 2008
171.892
+16.055
10.3%
jan 1, 2009
194.762
+22.87
13.3%
jan 1, 2010
196.155
+1.393
0.72%
jan 1, 2011
188.835
-7.32
-3.73%
jan 1, 2012
173.957
-14.878
-7.88%
jan 1, 2013
164.468
-9.488
-5.45%
jan 1, 2014
153.144
-11.324
-6.89%
jan 1, 2015
138.489
-14.655
-9.57%
jan 1, 2016
134.066
-4.423
-3.19%
Ranking of countries by current statistics by years


Comments: