29
/
en
AIzaSyAYiBZKx7MnpbEhh9jyipgxe19OcubqV5w
April 1, 2024
39829
IDA total
IDA
false
2
1
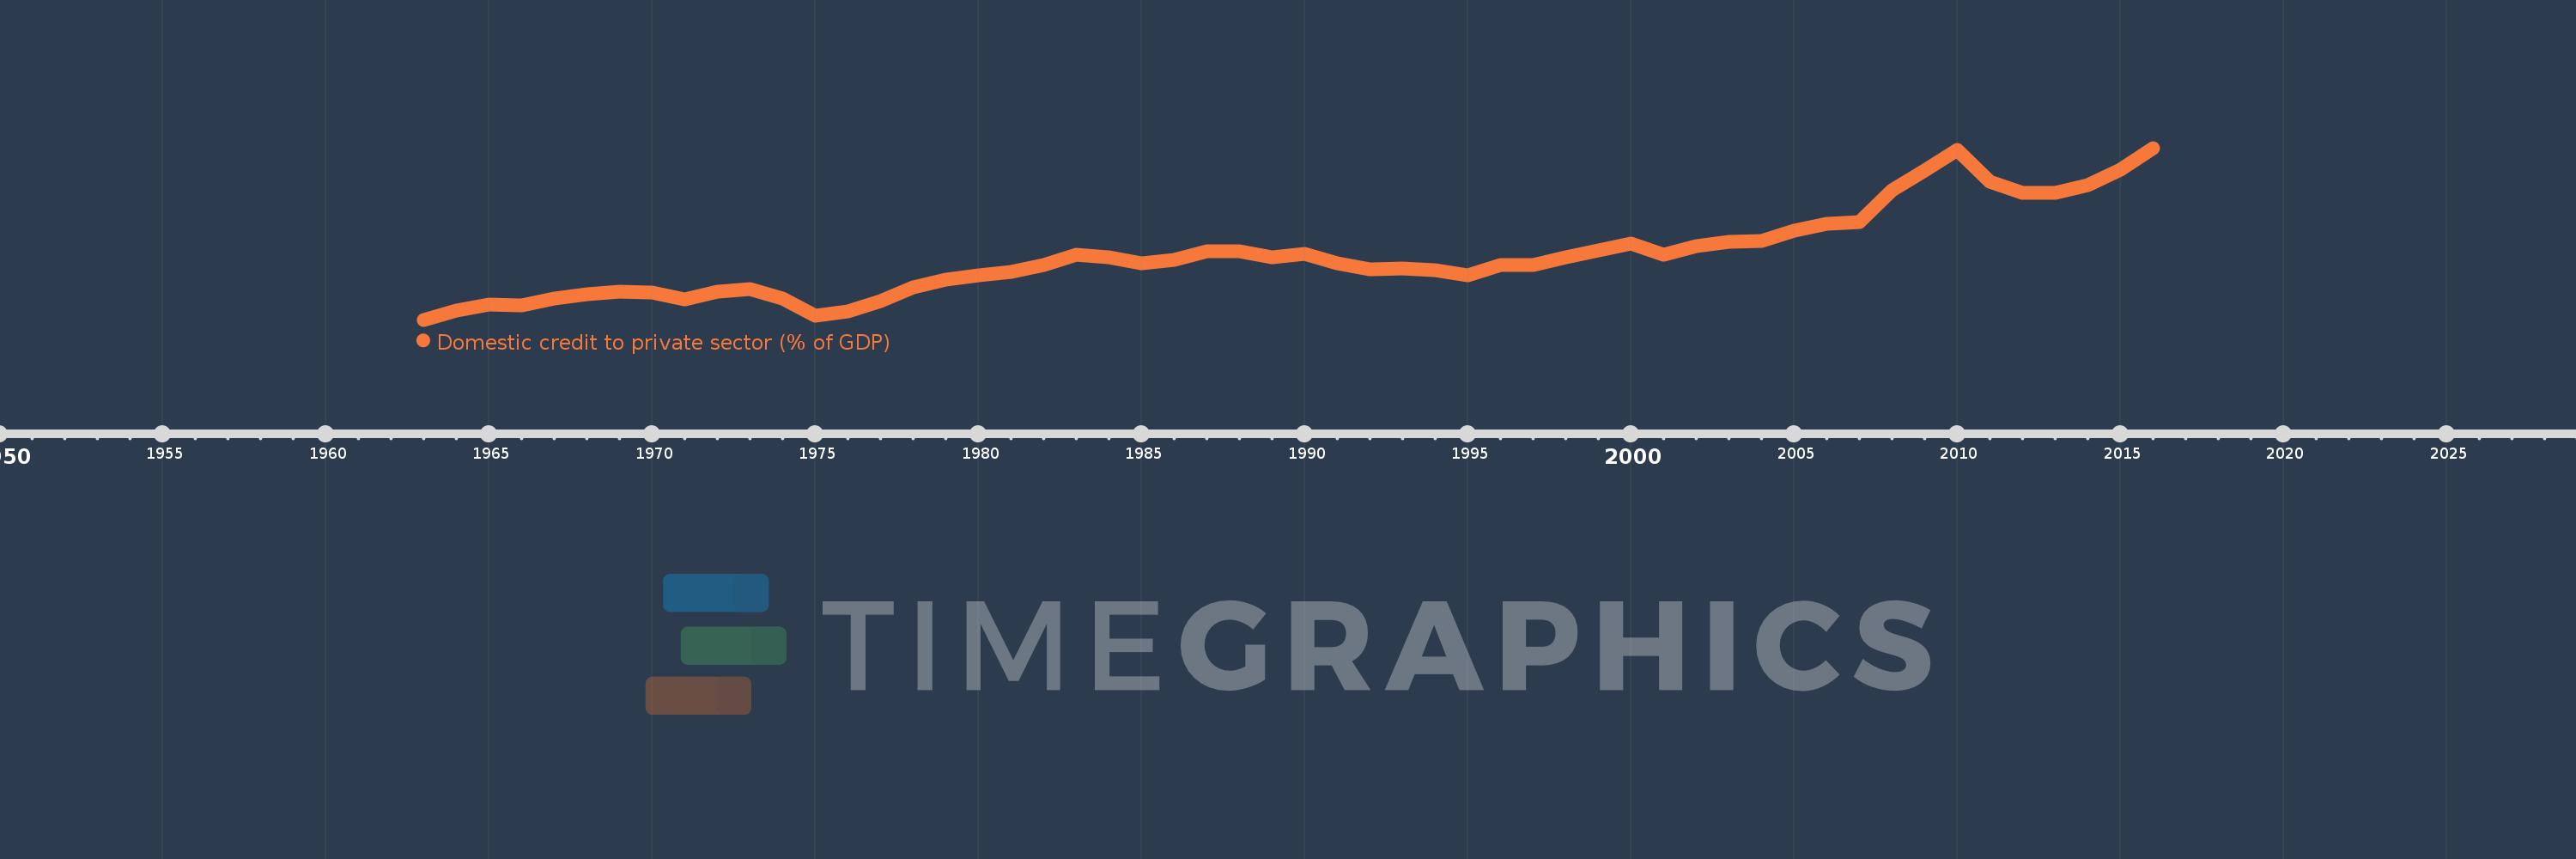
Domestic credit to private sector (% of GDP)
2016,2015,2014,2013,2012,2011,2010,2009,2008,2007,2006,2005,2004,2003,2002,2001,2000,1999,1998,1997,1996,1995,1994,1993,1992,1991,1990,1989,1988,1987,1986,1985,1984,1983,1982,1981,1980,1979,1978,1977,1976,1975,1974,1973,1972,1971,1970,1969,1968,1967,1966,1965,1964,1963
This statistics in other country:
AfghanistanAlbaniaAlgeriaAngolaAntigua and BarbudaArab WorldArgentinaArmeniaArubaAustraliaAustriaAzerbaijanBahamas, TheBahrainBangladeshBarbadosBelarusBelgiumBelizeBeninBhutanBoliviaBosnia and HerzegovinaBotswanaBrazilBrunei DarussalamBulgariaBurkina FasoBurundiCabo VerdeCambodiaCameroonCanadaCaribbean small statesCentral African RepublicCentral Europe and the BalticsChadChileChinaColombiaComorosCongo, Dem. Rep.Congo, Rep.Costa RicaCote d'IvoireCroatiaCyprusCzech RepublicDenmarkDjiboutiDominicaDominican RepublicEarly-demographic dividendEast Asia & PacificEast Asia & Pacific (excluding high income)East Asia & Pacific (IDA & IBRD countries)EcuadorEgypt, Arab Rep.El SalvadorEquatorial GuineaEritreaEstoniaEthiopiaEuro areaEurope & Central AsiaEurope & Central Asia (excluding high income)Europe & Central Asia (IDA & IBRD countries)European UnionFijiFinlandFragile and conflict affected situationsFranceGabonGambia, TheGeorgiaGermanyGhanaGreeceGrenadaGuatemalaGuineaGuinea-BissauGuyanaHaitiHeavily indebted poor countries (HIPC)High incomeHondurasHong Kong SAR, ChinaHungaryIBRD onlyIcelandIDA & IBRD totalIDA blendIDA onlyIDA totalIndiaIndonesiaIran, Islamic Rep.IraqIrelandIsraelItalyJamaicaJapanJordanKazakhstanKenyaKorea, Rep.KosovoKuwaitKyrgyz RepublicLao PDRLate-demographic dividendLatin America & Caribbean Latin America & Caribbean (excluding high income)Latin America & the Caribbean (IDA & IBRD countries)LatviaLeast developed countries: UN classificationLebanonLesothoLiberiaLibyaLithuaniaLow & middle incomeLow incomeLower middle incomeLuxembourgMacao SAR, ChinaMacedonia, FYRMadagascarMalawiMalaysiaMaldivesMaliMaltaMauritaniaMauritiusMexicoMicronesia, Fed. Sts.Middle East & North AfricaMiddle East & North Africa (excluding high income)Middle East & North Africa (IDA & IBRD countries)Middle incomeMoldovaMongoliaMontenegroMoroccoMozambiqueMyanmarNamibiaNepalNetherlandsNew ZealandNicaraguaNigerNigeriaNorth AmericaNorwayOECD membersOmanOther small statesPacific island small statesPakistanPanamaPapua New GuineaParaguayPeruPhilippinesPolandPortugalPost-demographic dividendPre-demographic dividendQatarRomaniaRussian FederationRwandaSamoaSao Tome and PrincipeSaudi ArabiaSenegalSerbiaSeychellesSierra LeoneSingaporeSlovak RepublicSloveniaSmall statesSolomon IslandsSouth AfricaSouth AsiaSouth Asia (IDA & IBRD)South SudanSpainSri LankaSt. Kitts and NevisSt. LuciaSt. Vincent and the GrenadinesSub-Saharan Africa Sub-Saharan Africa (excluding high income)Sub-Saharan Africa (IDA & IBRD countries)SudanSurinameSwazilandSwedenSwitzerlandSyrian Arab RepublicTajikistanTanzaniaThailandTimor-LesteTogoTongaTrinidad and TobagoTunisiaTurkeyUgandaUkraineUnited Arab EmiratesUnited KingdomUnited StatesUpper middle incomeUruguayVanuatuVenezuela, RBVietnamWest Bank and GazaWorldYemen, Rep.ZambiaZimbabwe Timeline:
This timeline shows a graph from 1963 to 2016 of IDA total. No data until 1962. Number of actual observations by date: 54.
Source name:
World Development Indicators
Source organization:
International Monetary Fund, International Financial Statistics and data files, and World Bank and OECD GDP estimates.
Categories, topics:
Financial Sector, Private Sector
Last updated:
apr 23, 2017
Indicators value changes by year
Maximum:
31.811
jan 1, 2016
At the date of observation
Value
Absolute change
Change from previous value
jan 1, 1963
9.92
+9.92
0.0%
jan 1, 1964
11.131
+1.211
12.2%
jan 1, 1965
11.888
+0.757
6.8%
jan 1, 1966
11.791
-0.098
-0.82%
jan 1, 1967
12.61
+0.819
6.95%
jan 1, 1968
13.165
+0.555
4.4%
jan 1, 1969
13.547
+0.382
2.9%
jan 1, 1970
13.375
-0.172
-1.27%
jan 1, 1971
12.527
-0.848
-6.34%
jan 1, 1972
13.552
+1.025
8.18%
jan 1, 1973
13.778
+0.226
1.67%
jan 1, 1974
12.603
-1.175
-8.53%
jan 1, 1975
10.431
-2.173
-17.24%
jan 1, 1976
10.936
+0.505
4.85%
jan 1, 1977
12.283
+1.347
12.32%
jan 1, 1978
14.012
+1.729
14.07%
jan 1, 1979
15.079
+1.067
7.62%
jan 1, 1980
15.628
+0.549
3.64%
jan 1, 1981
16.052
+0.425
2.72%
jan 1, 1982
16.873
+0.82
5.11%
jan 1, 1983
18.153
+1.281
7.59%
jan 1, 1984
17.828
-0.325
-1.79%
jan 1, 1985
17.113
-0.715
-4.01%
jan 1, 1986
17.505
+0.392
2.29%
jan 1, 1987
18.687
+1.182
6.75%
jan 1, 1988
18.592
-0.094
-0.5%
jan 1, 1989
17.89
-0.702
-3.78%
jan 1, 1990
18.264
+0.374
2.09%
jan 1, 1991
17.165
-1.099
-6.02%
jan 1, 1992
16.323
-0.841
-4.9%
jan 1, 1993
16.439
+0.116
0.71%
jan 1, 1994
16.286
-0.153
-0.93%
jan 1, 1995
15.629
-0.657
-4.04%
jan 1, 1996
16.882
+1.252
8.01%
jan 1, 1997
16.925
+0.044
0.26%
jan 1, 1998
17.884
+0.959
5.66%
jan 1, 1999
18.717
+0.833
4.66%
jan 1, 2000
19.59
+0.873
4.66%
jan 1, 2001
18.228
-1.362
-6.95%
jan 1, 2002
19.248
+1.02
5.6%
jan 1, 2003
19.861
+0.613
3.18%
jan 1, 2004
20.007
+0.147
0.74%
jan 1, 2005
21.226
+1.218
6.09%
jan 1, 2006
22.121
+0.895
4.22%
jan 1, 2007
22.33
+0.209
0.95%
jan 1, 2008
26.408
+4.078
18.26%
jan 1, 2009
28.93
+2.522
9.55%
jan 1, 2010
31.526
+2.596
8.97%
jan 1, 2011
27.478
-4.048
-12.84%
jan 1, 2012
26.063
-1.416
-5.15%
jan 1, 2013
26.093
+0.03
0.12%
jan 1, 2014
27.032
+0.939
3.6%
jan 1, 2015
28.995
+1.963
7.26%
jan 1, 2016
31.811
+2.816
9.71%
Ranking of countries by current statistics by years


Comments: