29
/
en
AIzaSyAYiBZKx7MnpbEhh9jyipgxe19OcubqV5w
April 1, 2024
219483
Papua New Guinea
PNG
true
2
1
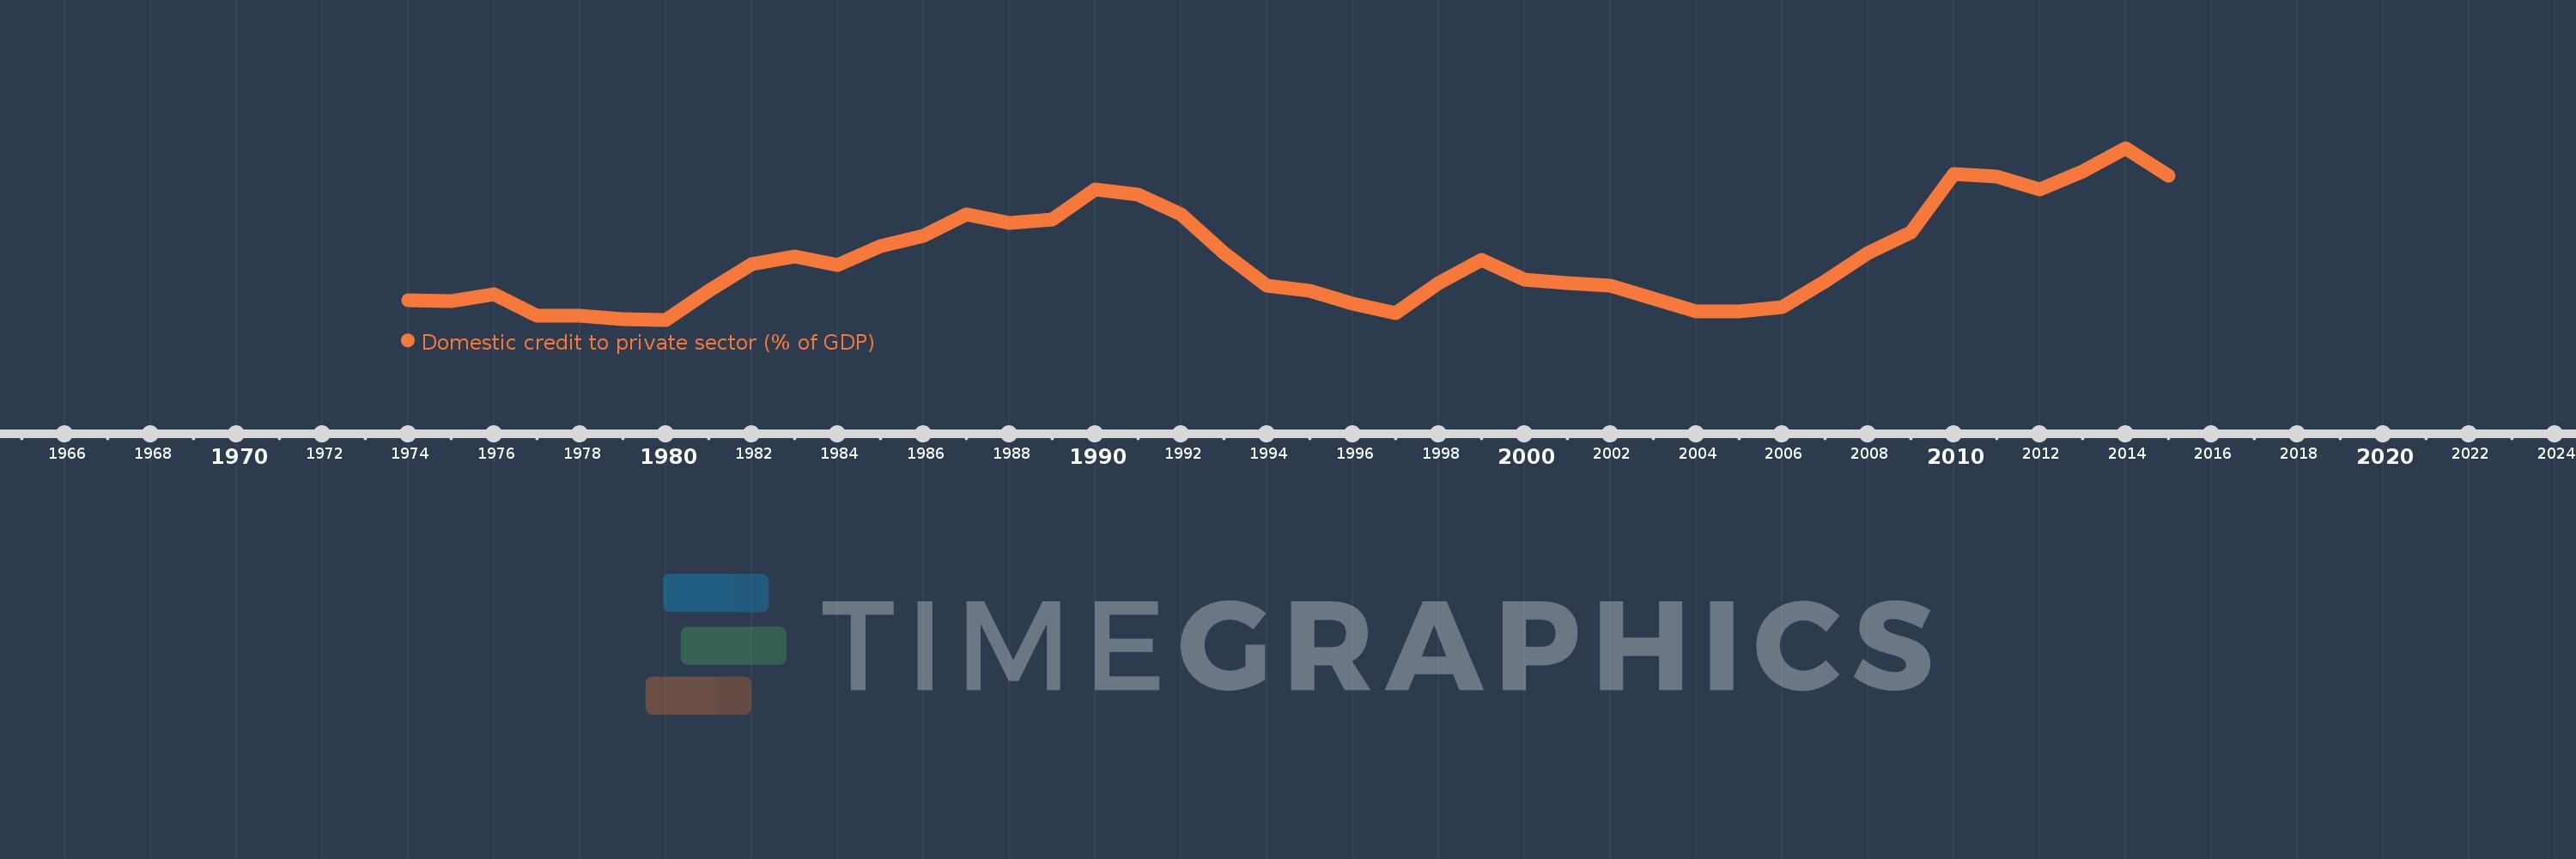
Domestic credit to private sector (% of GDP)
2015,2014,2013,2012,2011,2010,2009,2008,2007,2006,2005,2004,2003,2002,2001,2000,1999,1998,1997,1996,1995,1994,1993,1992,1991,1990,1989,1988,1987,1986,1985,1984,1983,1982,1981,1980,1979,1978,1977,1976,1975,1974
This statistics in other country:
AfghanistanAlbaniaAlgeriaAngolaAntigua and BarbudaArab WorldArgentinaArmeniaArubaAustraliaAustriaAzerbaijanBahamas, TheBahrainBangladeshBarbadosBelarusBelgiumBelizeBeninBhutanBoliviaBosnia and HerzegovinaBotswanaBrazilBrunei DarussalamBulgariaBurkina FasoBurundiCabo VerdeCambodiaCameroonCanadaCaribbean small statesCentral African RepublicCentral Europe and the BalticsChadChileChinaColombiaComorosCongo, Dem. Rep.Congo, Rep.Costa RicaCote d'IvoireCroatiaCyprusCzech RepublicDenmarkDjiboutiDominicaDominican RepublicEarly-demographic dividendEast Asia & PacificEast Asia & Pacific (excluding high income)East Asia & Pacific (IDA & IBRD countries)EcuadorEgypt, Arab Rep.El SalvadorEquatorial GuineaEritreaEstoniaEthiopiaEuro areaEurope & Central AsiaEurope & Central Asia (excluding high income)Europe & Central Asia (IDA & IBRD countries)European UnionFijiFinlandFragile and conflict affected situationsFranceGabonGambia, TheGeorgiaGermanyGhanaGreeceGrenadaGuatemalaGuineaGuinea-BissauGuyanaHaitiHeavily indebted poor countries (HIPC)High incomeHondurasHong Kong SAR, ChinaHungaryIBRD onlyIcelandIDA & IBRD totalIDA blendIDA onlyIDA totalIndiaIndonesiaIran, Islamic Rep.IraqIrelandIsraelItalyJamaicaJapanJordanKazakhstanKenyaKorea, Rep.KosovoKuwaitKyrgyz RepublicLao PDRLate-demographic dividendLatin America & Caribbean Latin America & Caribbean (excluding high income)Latin America & the Caribbean (IDA & IBRD countries)LatviaLeast developed countries: UN classificationLebanonLesothoLiberiaLibyaLithuaniaLow & middle incomeLow incomeLower middle incomeLuxembourgMacao SAR, ChinaMacedonia, FYRMadagascarMalawiMalaysiaMaldivesMaliMaltaMauritaniaMauritiusMexicoMicronesia, Fed. Sts.Middle East & North AfricaMiddle East & North Africa (excluding high income)Middle East & North Africa (IDA & IBRD countries)Middle incomeMoldovaMongoliaMontenegroMoroccoMozambiqueMyanmarNamibiaNepalNetherlandsNew ZealandNicaraguaNigerNigeriaNorth AmericaNorwayOECD membersOmanOther small statesPacific island small statesPakistanPanamaPapua New GuineaParaguayPeruPhilippinesPolandPortugalPost-demographic dividendPre-demographic dividendQatarRomaniaRussian FederationRwandaSamoaSao Tome and PrincipeSaudi ArabiaSenegalSerbiaSeychellesSierra LeoneSingaporeSlovak RepublicSloveniaSmall statesSolomon IslandsSouth AfricaSouth AsiaSouth Asia (IDA & IBRD)South SudanSpainSri LankaSt. Kitts and NevisSt. LuciaSt. Vincent and the GrenadinesSub-Saharan Africa Sub-Saharan Africa (excluding high income)Sub-Saharan Africa (IDA & IBRD countries)SudanSurinameSwazilandSwedenSwitzerlandSyrian Arab RepublicTajikistanTanzaniaThailandTimor-LesteTogoTongaTrinidad and TobagoTunisiaTurkeyUgandaUkraineUnited Arab EmiratesUnited KingdomUnited StatesUpper middle incomeUruguayVanuatuVenezuela, RBVietnamWest Bank and GazaWorldYemen, Rep.ZambiaZimbabwe Timeline:
This timeline shows a graph from 1974 to 2015 of Papua New Guinea. No data until 1973. Number of actual observations by date: 42.
Source name:
World Development Indicators
Source organization:
International Monetary Fund, International Financial Statistics and data files, and World Bank and OECD GDP estimates.
Categories, topics:
Financial Sector, Private Sector
Last updated:
apr 23, 2017
Indicators value changes by year
Minimum:
12.519
jan 1, 1980
Maximum:
34.623
jan 1, 2014
At the date of observation
Value
Absolute change
Change from previous value
jan 1, 1974
14.996
+14.996
0.0%
jan 1, 1975
14.873
-0.123
-0.82%
jan 1, 1976
15.759
+0.886
5.96%
jan 1, 1977
13.067
-2.692
-17.08%
jan 1, 1978
13.015
-0.052
-0.4%
jan 1, 1979
12.582
-0.433
-3.33%
jan 1, 1980
12.519
-0.063
-0.5%
jan 1, 1981
16.253
+3.734
29.82%
jan 1, 1982
19.647
+3.395
20.89%
jan 1, 1983
20.65
+1.003
5.11%
jan 1, 1984
19.505
-1.145
-5.55%
jan 1, 1985
22.029
+2.524
12.94%
jan 1, 1986
23.352
+1.323
6.01%
jan 1, 1987
26.067
+2.715
11.62%
jan 1, 1988
24.929
-1.138
-4.36%
jan 1, 1989
25.378
+0.449
1.8%
jan 1, 1990
29.231
+3.853
15.18%
jan 1, 1991
28.578
-0.653
-2.23%
jan 1, 1992
26.132
-2.445
-8.56%
jan 1, 1993
21.118
-5.015
-19.19%
jan 1, 1994
16.867
-4.25
-20.13%
jan 1, 1995
16.248
-0.62
-3.67%
jan 1, 1996
14.551
-1.696
-10.44%
jan 1, 1997
13.387
-1.165
-8.0%
jan 1, 1998
17.287
+3.9
29.13%
jan 1, 1999
20.229
+2.943
17.02%
jan 1, 2000
17.651
-2.579
-12.75%
jan 1, 2001
17.193
-0.457
-2.59%
jan 1, 2002
16.886
-0.307
-1.79%
jan 1, 2003
15.273
-1.613
-9.55%
jan 1, 2004
13.586
-1.687
-11.05%
jan 1, 2005
13.623
+0.037
0.27%
jan 1, 2006
14.13
+0.507
3.72%
jan 1, 2007
17.452
+3.323
23.51%
jan 1, 2008
21.068
+3.615
20.72%
jan 1, 2009
23.741
+2.674
12.69%
jan 1, 2010
31.233
+7.492
31.56%
jan 1, 2011
30.935
-0.298
-0.95%
jan 1, 2012
29.245
-1.69
-5.46%
jan 1, 2013
31.624
+2.379
8.14%
jan 1, 2014
34.623
+2.999
9.48%
jan 1, 2015
31.022
-3.601
-10.4%
Ranking of countries by current statistics by years


Comments: