29
/
en
AIzaSyAYiBZKx7MnpbEhh9jyipgxe19OcubqV5w
April 1, 2024
277524
Uruguay
URY
true
2
1
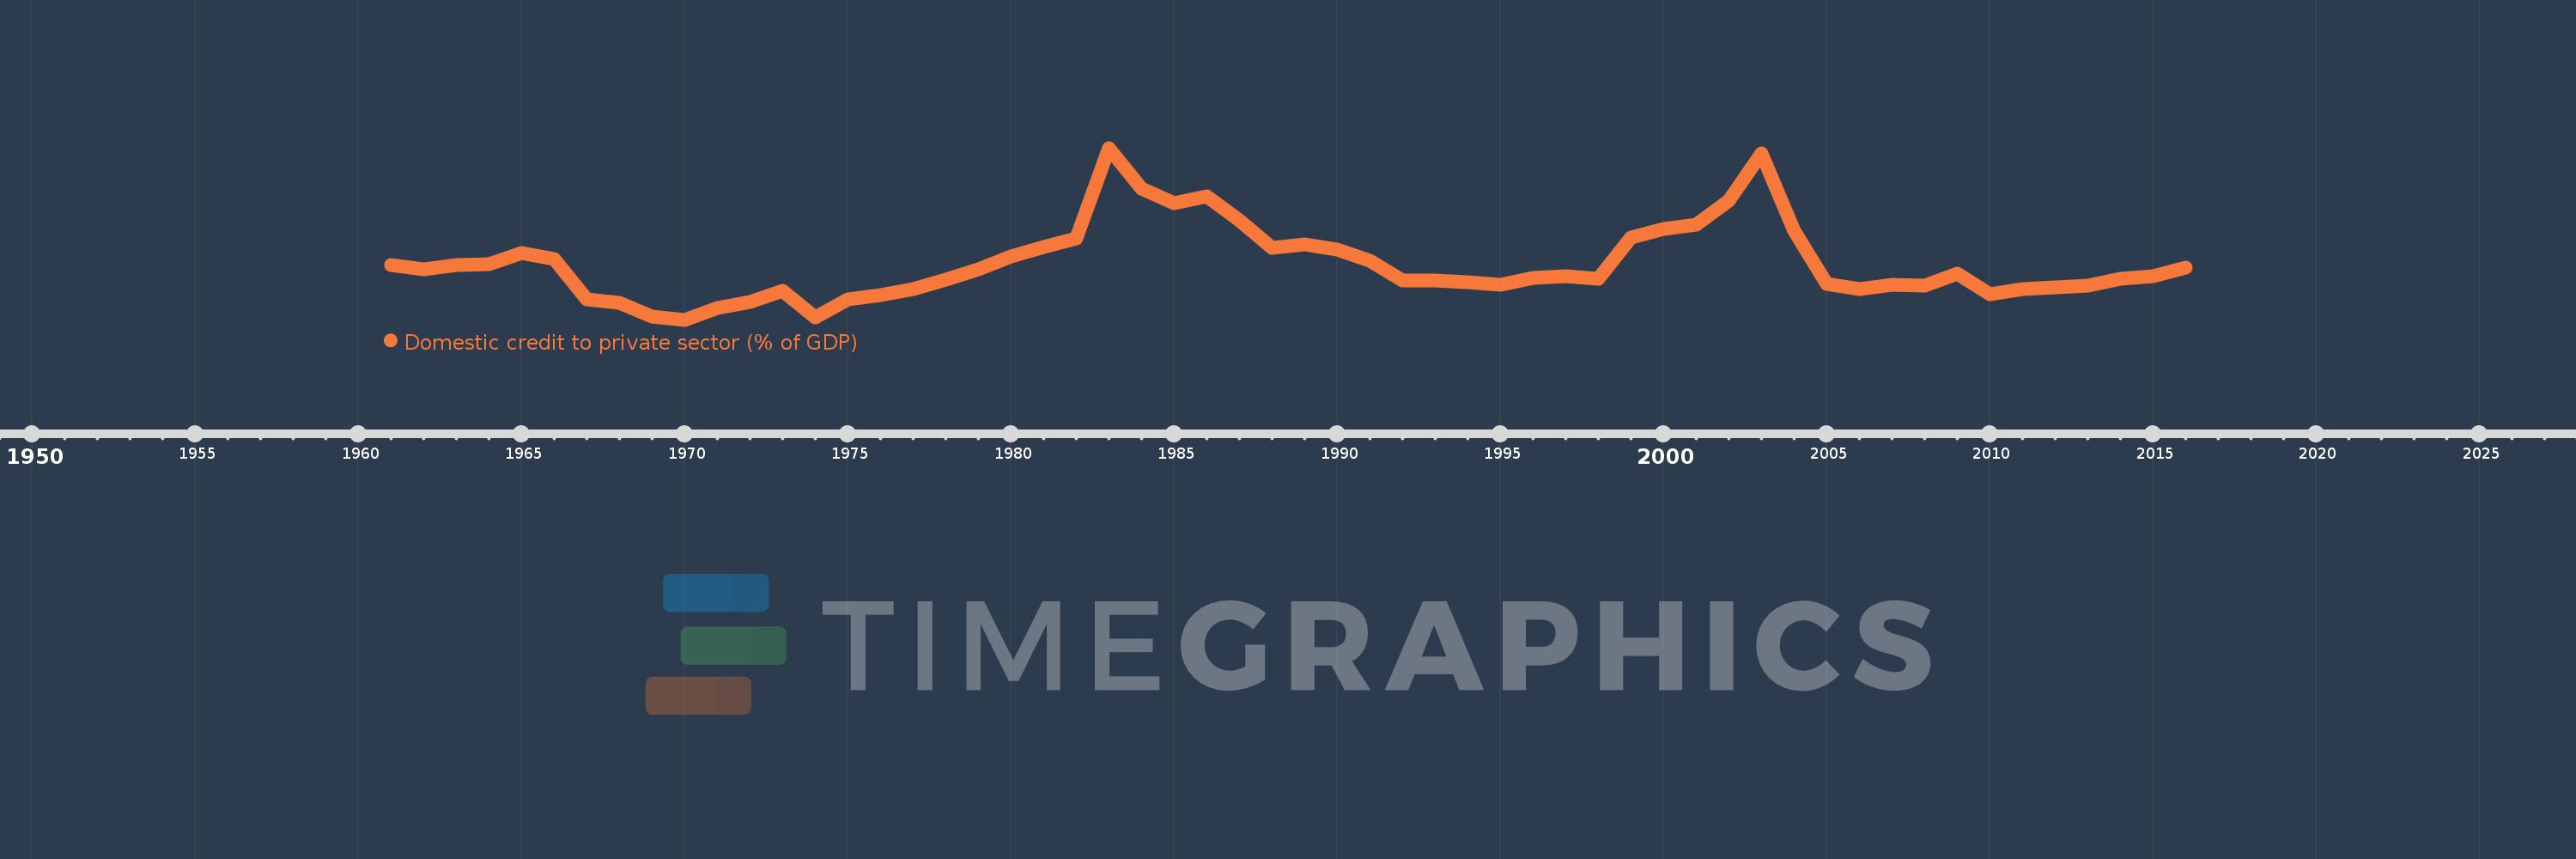
Domestic credit to private sector (% of GDP)
2016,2015,2014,2013,2012,2011,2010,2009,2008,2007,2006,2005,2004,2003,2002,2001,2000,1999,1998,1997,1996,1995,1994,1993,1992,1991,1990,1989,1988,1987,1986,1985,1984,1983,1982,1981,1980,1979,1978,1977,1976,1975,1974,1973,1972,1971,1970,1969,1968,1967,1966,1965,1964,1963,1962,1961
This statistics in other country:
AfghanistanAlbaniaAlgeriaAngolaAntigua and BarbudaArab WorldArgentinaArmeniaArubaAustraliaAustriaAzerbaijanBahamas, TheBahrainBangladeshBarbadosBelarusBelgiumBelizeBeninBhutanBoliviaBosnia and HerzegovinaBotswanaBrazilBrunei DarussalamBulgariaBurkina FasoBurundiCabo VerdeCambodiaCameroonCanadaCaribbean small statesCentral African RepublicCentral Europe and the BalticsChadChileChinaColombiaComorosCongo, Dem. Rep.Congo, Rep.Costa RicaCote d'IvoireCroatiaCyprusCzech RepublicDenmarkDjiboutiDominicaDominican RepublicEarly-demographic dividendEast Asia & PacificEast Asia & Pacific (excluding high income)East Asia & Pacific (IDA & IBRD countries)EcuadorEgypt, Arab Rep.El SalvadorEquatorial GuineaEritreaEstoniaEthiopiaEuro areaEurope & Central AsiaEurope & Central Asia (excluding high income)Europe & Central Asia (IDA & IBRD countries)European UnionFijiFinlandFragile and conflict affected situationsFranceGabonGambia, TheGeorgiaGermanyGhanaGreeceGrenadaGuatemalaGuineaGuinea-BissauGuyanaHaitiHeavily indebted poor countries (HIPC)High incomeHondurasHong Kong SAR, ChinaHungaryIBRD onlyIcelandIDA & IBRD totalIDA blendIDA onlyIDA totalIndiaIndonesiaIran, Islamic Rep.IraqIrelandIsraelItalyJamaicaJapanJordanKazakhstanKenyaKorea, Rep.KosovoKuwaitKyrgyz RepublicLao PDRLate-demographic dividendLatin America & Caribbean Latin America & Caribbean (excluding high income)Latin America & the Caribbean (IDA & IBRD countries)LatviaLeast developed countries: UN classificationLebanonLesothoLiberiaLibyaLithuaniaLow & middle incomeLow incomeLower middle incomeLuxembourgMacao SAR, ChinaMacedonia, FYRMadagascarMalawiMalaysiaMaldivesMaliMaltaMauritaniaMauritiusMexicoMicronesia, Fed. Sts.Middle East & North AfricaMiddle East & North Africa (excluding high income)Middle East & North Africa (IDA & IBRD countries)Middle incomeMoldovaMongoliaMontenegroMoroccoMozambiqueMyanmarNamibiaNepalNetherlandsNew ZealandNicaraguaNigerNigeriaNorth AmericaNorwayOECD membersOmanOther small statesPacific island small statesPakistanPanamaPapua New GuineaParaguayPeruPhilippinesPolandPortugalPost-demographic dividendPre-demographic dividendQatarRomaniaRussian FederationRwandaSamoaSao Tome and PrincipeSaudi ArabiaSenegalSerbiaSeychellesSierra LeoneSingaporeSlovak RepublicSloveniaSmall statesSolomon IslandsSouth AfricaSouth AsiaSouth Asia (IDA & IBRD)South SudanSpainSri LankaSt. Kitts and NevisSt. LuciaSt. Vincent and the GrenadinesSub-Saharan Africa Sub-Saharan Africa (excluding high income)Sub-Saharan Africa (IDA & IBRD countries)SudanSurinameSwazilandSwedenSwitzerlandSyrian Arab RepublicTajikistanTanzaniaThailandTimor-LesteTogoTongaTrinidad and TobagoTunisiaTurkeyUgandaUkraineUnited Arab EmiratesUnited KingdomUnited StatesUpper middle incomeUruguayVanuatuVenezuela, RBVietnamWest Bank and GazaWorldYemen, Rep.ZambiaZimbabwe Timeline:
This timeline shows a graph from 1961 to 2016 of Uruguay. No data until 1960. Number of actual observations by date: 56.
Source name:
World Development Indicators
Source organization:
International Monetary Fund, International Financial Statistics and data files, and World Bank and OECD GDP estimates.
Categories, topics:
Financial Sector, Private Sector
Last updated:
apr 23, 2017
Indicators value changes by year
Minimum:
11.461
jan 1, 1970
Maximum:
72.382
jan 1, 1983
At the date of observation
Value
Absolute change
Change from previous value
jan 1, 1961
30.952
+30.952
0.0%
jan 1, 1962
29.324
-1.628
-5.26%
jan 1, 1963
30.799
+1.475
5.03%
jan 1, 1964
31.266
+0.467
1.52%
jan 1, 1965
35.036
+3.77
12.06%
jan 1, 1966
32.933
-2.103
-6.0%
jan 1, 1967
18.721
-14.212
-43.15%
jan 1, 1968
17.547
-1.174
-6.27%
jan 1, 1969
12.482
-5.065
-28.87%
jan 1, 1970
11.461
-1.021
-8.18%
jan 1, 1971
15.729
+4.268
37.24%
jan 1, 1972
17.73
+2.001
12.72%
jan 1, 1973
21.733
+4.003
22.58%
jan 1, 1974
12.174
-9.559
-43.99%
jan 1, 1975
18.729
+6.555
53.85%
jan 1, 1976
20.174
+1.446
7.72%
jan 1, 1977
22.344
+2.169
10.75%
jan 1, 1978
25.733
+3.389
15.17%
jan 1, 1979
29.341
+3.608
14.02%
jan 1, 1980
33.948
+4.607
15.7%
jan 1, 1981
37.236
+3.288
9.68%
jan 1, 1982
40.424
+3.188
8.56%
jan 1, 1983
72.382
+31.958
79.06%
jan 1, 1984
57.962
-14.421
-19.92%
jan 1, 1985
52.829
-5.133
-8.86%
jan 1, 1986
55.286
+2.458
4.65%
jan 1, 1987
46.777
-8.509
-15.39%
jan 1, 1988
37.053
-9.724
-20.79%
jan 1, 1989
38.315
+1.263
3.41%
jan 1, 1990
36.331
-1.985
-5.18%
jan 1, 1991
32.44
-3.891
-10.71%
jan 1, 1992
25.512
-6.928
-21.36%
jan 1, 1993
25.32
-0.192
-0.75%
jan 1, 1994
24.863
-0.456
-1.8%
jan 1, 1995
23.856
-1.008
-4.05%
jan 1, 1996
26.438
+2.582
10.83%
jan 1, 1997
26.808
+0.369
1.4%
jan 1, 1998
25.906
-0.902
-3.36%
jan 1, 1999
40.521
+14.615
56.42%
jan 1, 2000
43.596
+3.074
7.59%
jan 1, 2001
45.094
+1.498
3.44%
jan 1, 2002
53.854
+8.76
19.43%
jan 1, 2003
70.512
+16.658
30.93%
jan 1, 2004
43.187
-27.325
-38.75%
jan 1, 2005
24.193
-18.993
-43.98%
jan 1, 2006
22.475
-1.718
-7.1%
jan 1, 2007
23.948
+1.473
6.56%
jan 1, 2008
23.411
-0.537
-2.24%
jan 1, 2009
27.843
+4.432
18.93%
jan 1, 2010
20.522
-7.321
-26.29%
jan 1, 2011
22.289
+1.767
8.61%
jan 1, 2012
23.064
+0.775
3.48%
jan 1, 2013
23.454
+0.39
1.69%
jan 1, 2014
25.99
+2.536
10.81%
jan 1, 2015
27.04
+1.05
4.04%
jan 1, 2016
30.02
+2.98
11.02%
Ranking of countries by current statistics by years


Comments: