29
/
en
AIzaSyAYiBZKx7MnpbEhh9jyipgxe19OcubqV5w
April 1, 2024
47022
Lower middle income
LMC
false
2
1
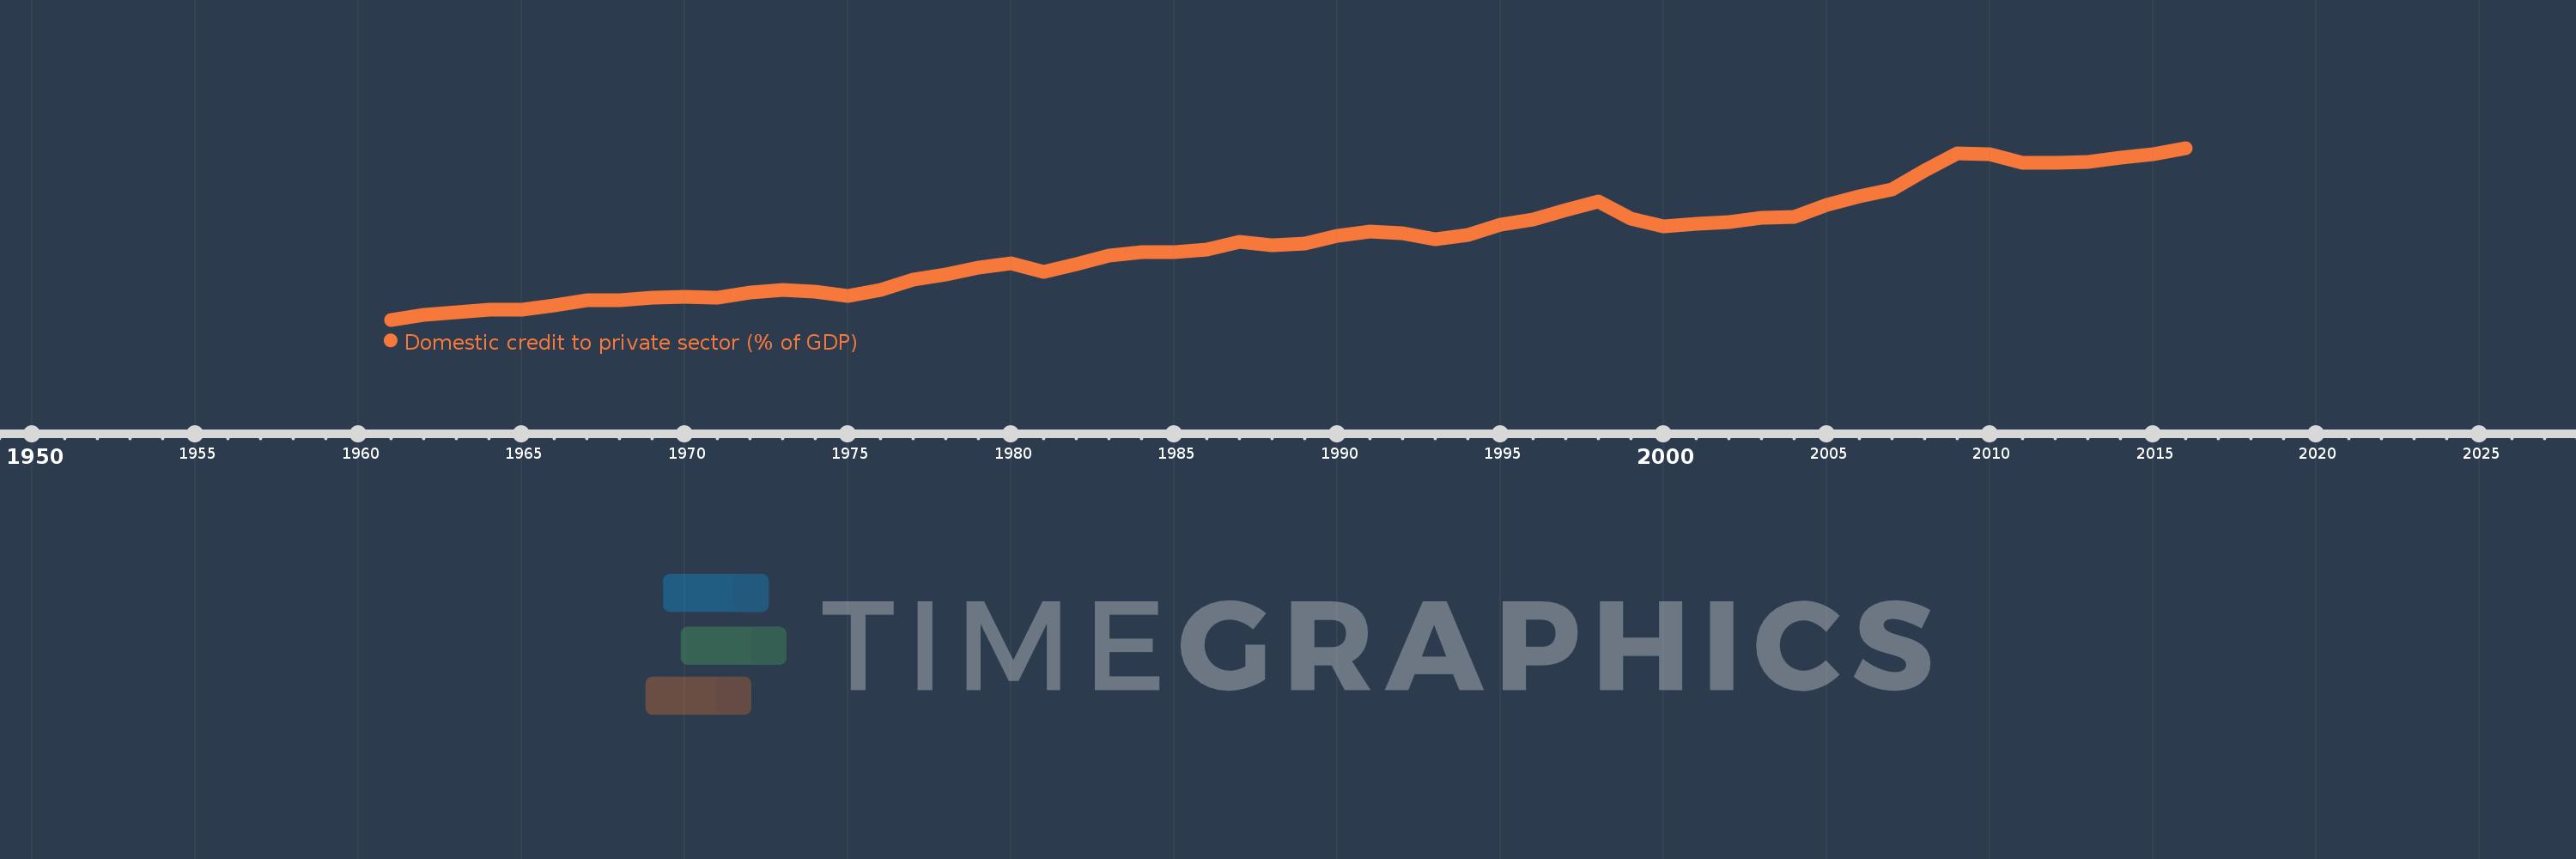
Domestic credit to private sector (% of GDP)
2016,2015,2014,2013,2012,2011,2010,2009,2008,2007,2006,2005,2004,2003,2002,2001,2000,1999,1998,1997,1996,1995,1994,1993,1992,1991,1990,1989,1988,1987,1986,1985,1984,1983,1982,1981,1980,1979,1978,1977,1976,1975,1974,1973,1972,1971,1970,1969,1968,1967,1966,1965,1964,1963,1962,1961
This statistics in other country:
AfghanistanAlbaniaAlgeriaAngolaAntigua and BarbudaArab WorldArgentinaArmeniaArubaAustraliaAustriaAzerbaijanBahamas, TheBahrainBangladeshBarbadosBelarusBelgiumBelizeBeninBhutanBoliviaBosnia and HerzegovinaBotswanaBrazilBrunei DarussalamBulgariaBurkina FasoBurundiCabo VerdeCambodiaCameroonCanadaCaribbean small statesCentral African RepublicCentral Europe and the BalticsChadChileChinaColombiaComorosCongo, Dem. Rep.Congo, Rep.Costa RicaCote d'IvoireCroatiaCyprusCzech RepublicDenmarkDjiboutiDominicaDominican RepublicEarly-demographic dividendEast Asia & PacificEast Asia & Pacific (excluding high income)East Asia & Pacific (IDA & IBRD countries)EcuadorEgypt, Arab Rep.El SalvadorEquatorial GuineaEritreaEstoniaEthiopiaEuro areaEurope & Central AsiaEurope & Central Asia (excluding high income)Europe & Central Asia (IDA & IBRD countries)European UnionFijiFinlandFragile and conflict affected situationsFranceGabonGambia, TheGeorgiaGermanyGhanaGreeceGrenadaGuatemalaGuineaGuinea-BissauGuyanaHaitiHeavily indebted poor countries (HIPC)High incomeHondurasHong Kong SAR, ChinaHungaryIBRD onlyIcelandIDA & IBRD totalIDA blendIDA onlyIDA totalIndiaIndonesiaIran, Islamic Rep.IraqIrelandIsraelItalyJamaicaJapanJordanKazakhstanKenyaKorea, Rep.KosovoKuwaitKyrgyz RepublicLao PDRLate-demographic dividendLatin America & Caribbean Latin America & Caribbean (excluding high income)Latin America & the Caribbean (IDA & IBRD countries)LatviaLeast developed countries: UN classificationLebanonLesothoLiberiaLibyaLithuaniaLow & middle incomeLow incomeLower middle incomeLuxembourgMacao SAR, ChinaMacedonia, FYRMadagascarMalawiMalaysiaMaldivesMaliMaltaMauritaniaMauritiusMexicoMicronesia, Fed. Sts.Middle East & North AfricaMiddle East & North Africa (excluding high income)Middle East & North Africa (IDA & IBRD countries)Middle incomeMoldovaMongoliaMontenegroMoroccoMozambiqueMyanmarNamibiaNepalNetherlandsNew ZealandNicaraguaNigerNigeriaNorth AmericaNorwayOECD membersOmanOther small statesPacific island small statesPakistanPanamaPapua New GuineaParaguayPeruPhilippinesPolandPortugalPost-demographic dividendPre-demographic dividendQatarRomaniaRussian FederationRwandaSamoaSao Tome and PrincipeSaudi ArabiaSenegalSerbiaSeychellesSierra LeoneSingaporeSlovak RepublicSloveniaSmall statesSolomon IslandsSouth AfricaSouth AsiaSouth Asia (IDA & IBRD)South SudanSpainSri LankaSt. Kitts and NevisSt. LuciaSt. Vincent and the GrenadinesSub-Saharan Africa Sub-Saharan Africa (excluding high income)Sub-Saharan Africa (IDA & IBRD countries)SudanSurinameSwazilandSwedenSwitzerlandSyrian Arab RepublicTajikistanTanzaniaThailandTimor-LesteTogoTongaTrinidad and TobagoTunisiaTurkeyUgandaUkraineUnited Arab EmiratesUnited KingdomUnited StatesUpper middle incomeUruguayVanuatuVenezuela, RBVietnamWest Bank and GazaWorldYemen, Rep.ZambiaZimbabwe Timeline:
This timeline shows a graph from 1961 to 2016 of Lower middle income. No data until 1960. Number of actual observations by date: 56.
Source name:
World Development Indicators
Source organization:
International Monetary Fund, International Financial Statistics and data files, and World Bank and OECD GDP estimates.
Categories, topics:
Financial Sector, Private Sector
Last updated:
apr 23, 2017
Indicators value changes by year
At the date of observation
Value
Absolute change
Change from previous value
jan 1, 1961
8.509
+8.509
0.0%
jan 1, 1962
9.48
+0.971
11.41%
jan 1, 1963
9.954
+0.474
5.0%
jan 1, 1964
10.505
+0.551
5.53%
jan 1, 1965
10.444
-0.061
-0.58%
jan 1, 1966
11.37
+0.926
8.87%
jan 1, 1967
12.364
+0.994
8.74%
jan 1, 1968
12.446
+0.083
0.67%
jan 1, 1969
12.986
+0.54
4.34%
jan 1, 1970
13.047
+0.061
0.47%
jan 1, 1971
12.891
-0.156
-1.19%
jan 1, 1972
13.948
+1.057
8.2%
jan 1, 1973
14.39
+0.442
3.17%
jan 1, 1974
14.084
-0.306
-2.13%
jan 1, 1975
13.214
-0.87
-6.18%
jan 1, 1976
14.532
+1.318
9.97%
jan 1, 1977
16.52
+1.988
13.68%
jan 1, 1978
17.636
+1.116
6.75%
jan 1, 1979
18.963
+1.328
7.53%
jan 1, 1980
19.843
+0.88
4.64%
jan 1, 1981
18.074
-1.769
-8.91%
jan 1, 1982
19.611
+1.537
8.5%
jan 1, 1983
21.381
+1.769
9.02%
jan 1, 1984
22.06
+0.679
3.18%
jan 1, 1985
21.959
-0.101
-0.46%
jan 1, 1986
22.588
+0.629
2.87%
jan 1, 1987
24.093
+1.505
6.66%
jan 1, 1988
23.391
-0.702
-2.92%
jan 1, 1989
23.79
+0.4
1.71%
jan 1, 1990
25.336
+1.546
6.5%
jan 1, 1991
26.175
+0.84
3.31%
jan 1, 1992
25.829
-0.346
-1.32%
jan 1, 1993
24.613
-1.216
-4.71%
jan 1, 1994
25.541
+0.928
3.77%
jan 1, 1995
27.449
+1.908
7.47%
jan 1, 1996
28.636
+1.187
4.32%
jan 1, 1997
30.394
+1.758
6.14%
jan 1, 1998
32.167
+1.772
5.83%
jan 1, 1999
28.74
-3.427
-10.65%
jan 1, 2000
27.243
-1.496
-5.21%
jan 1, 2001
27.72
+0.477
1.75%
jan 1, 2002
28.117
+0.397
1.43%
jan 1, 2003
28.981
+0.864
3.07%
jan 1, 2004
29.034
+0.053
0.18%
jan 1, 2005
31.493
+2.459
8.47%
jan 1, 2006
33.238
+1.745
5.54%
jan 1, 2007
34.626
+1.388
4.18%
jan 1, 2008
38.302
+3.676
10.62%
jan 1, 2009
41.858
+3.555
9.28%
jan 1, 2010
41.566
-0.291
-0.7%
jan 1, 2011
39.926
-1.64
-3.95%
jan 1, 2012
39.826
-0.1
-0.25%
jan 1, 2013
40.133
+0.307
0.77%
jan 1, 2014
40.958
+0.825
2.06%
jan 1, 2015
41.608
+0.65
1.59%
jan 1, 2016
42.86
+1.252
3.01%
Ranking of countries by current statistics by years


Comments: