29
/
en
AIzaSyAYiBZKx7MnpbEhh9jyipgxe19OcubqV5w
April 1, 2024
207800
Netherlands
NLD
true
2
1
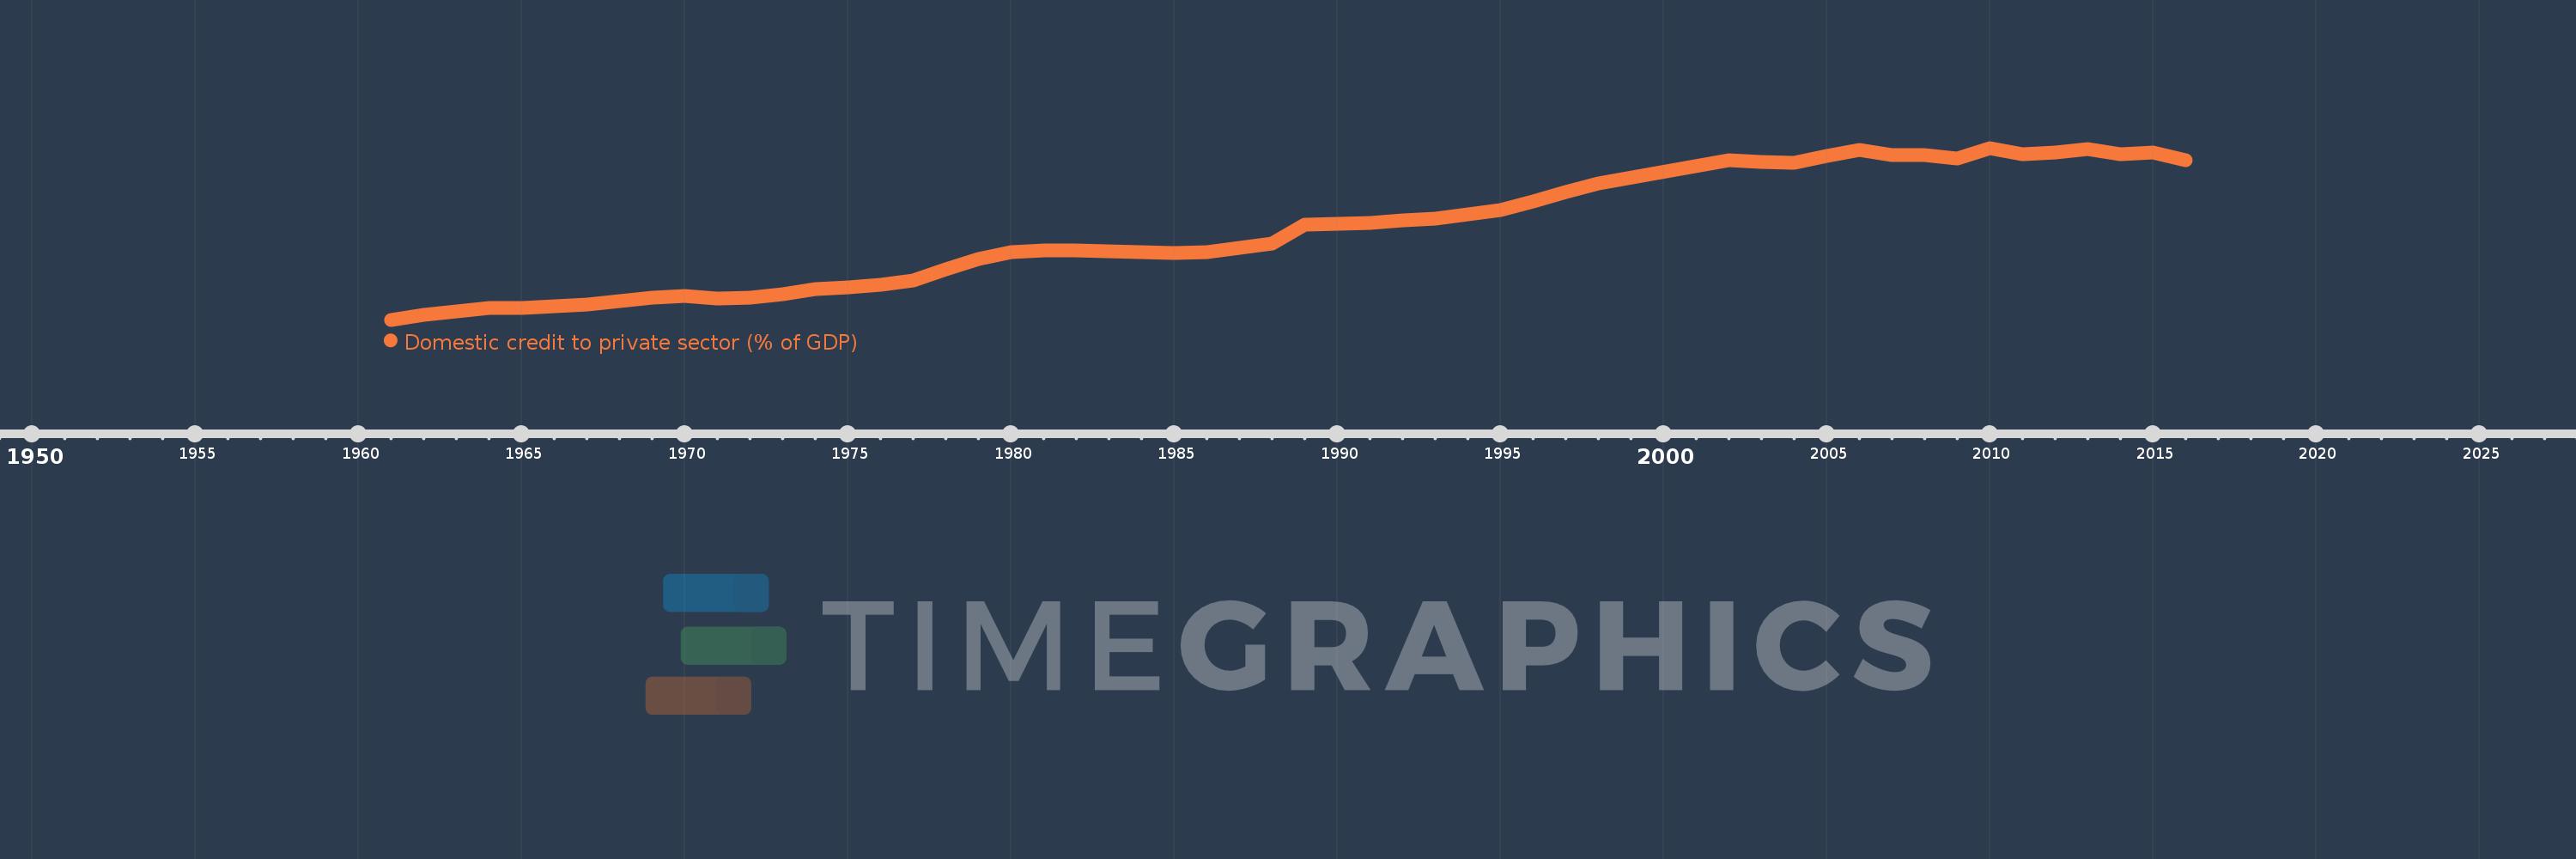
Domestic credit to private sector (% of GDP)
2016,2015,2014,2013,2012,2011,2010,2009,2008,2007,2006,2005,2004,2003,2002,1998,1997,1996,1995,1994,1993,1992,1991,1990,1989,1988,1987,1986,1985,1984,1983,1982,1981,1980,1979,1978,1977,1976,1975,1974,1973,1972,1971,1970,1969,1968,1967,1966,1965,1964,1963,1962,1961
This statistics in other country:
AfghanistanAlbaniaAlgeriaAngolaAntigua and BarbudaArab WorldArgentinaArmeniaArubaAustraliaAustriaAzerbaijanBahamas, TheBahrainBangladeshBarbadosBelarusBelgiumBelizeBeninBhutanBoliviaBosnia and HerzegovinaBotswanaBrazilBrunei DarussalamBulgariaBurkina FasoBurundiCabo VerdeCambodiaCameroonCanadaCaribbean small statesCentral African RepublicCentral Europe and the BalticsChadChileChinaColombiaComorosCongo, Dem. Rep.Congo, Rep.Costa RicaCote d'IvoireCroatiaCyprusCzech RepublicDenmarkDjiboutiDominicaDominican RepublicEarly-demographic dividendEast Asia & PacificEast Asia & Pacific (excluding high income)East Asia & Pacific (IDA & IBRD countries)EcuadorEgypt, Arab Rep.El SalvadorEquatorial GuineaEritreaEstoniaEthiopiaEuro areaEurope & Central AsiaEurope & Central Asia (excluding high income)Europe & Central Asia (IDA & IBRD countries)European UnionFijiFinlandFragile and conflict affected situationsFranceGabonGambia, TheGeorgiaGermanyGhanaGreeceGrenadaGuatemalaGuineaGuinea-BissauGuyanaHaitiHeavily indebted poor countries (HIPC)High incomeHondurasHong Kong SAR, ChinaHungaryIBRD onlyIcelandIDA & IBRD totalIDA blendIDA onlyIDA totalIndiaIndonesiaIran, Islamic Rep.IraqIrelandIsraelItalyJamaicaJapanJordanKazakhstanKenyaKorea, Rep.KosovoKuwaitKyrgyz RepublicLao PDRLate-demographic dividendLatin America & Caribbean Latin America & Caribbean (excluding high income)Latin America & the Caribbean (IDA & IBRD countries)LatviaLeast developed countries: UN classificationLebanonLesothoLiberiaLibyaLithuaniaLow & middle incomeLow incomeLower middle incomeLuxembourgMacao SAR, ChinaMacedonia, FYRMadagascarMalawiMalaysiaMaldivesMaliMaltaMauritaniaMauritiusMexicoMicronesia, Fed. Sts.Middle East & North AfricaMiddle East & North Africa (excluding high income)Middle East & North Africa (IDA & IBRD countries)Middle incomeMoldovaMongoliaMontenegroMoroccoMozambiqueMyanmarNamibiaNepalNetherlandsNew ZealandNicaraguaNigerNigeriaNorth AmericaNorwayOECD membersOmanOther small statesPacific island small statesPakistanPanamaPapua New GuineaParaguayPeruPhilippinesPolandPortugalPost-demographic dividendPre-demographic dividendQatarRomaniaRussian FederationRwandaSamoaSao Tome and PrincipeSaudi ArabiaSenegalSerbiaSeychellesSierra LeoneSingaporeSlovak RepublicSloveniaSmall statesSolomon IslandsSouth AfricaSouth AsiaSouth Asia (IDA & IBRD)South SudanSpainSri LankaSt. Kitts and NevisSt. LuciaSt. Vincent and the GrenadinesSub-Saharan Africa Sub-Saharan Africa (excluding high income)Sub-Saharan Africa (IDA & IBRD countries)SudanSurinameSwazilandSwedenSwitzerlandSyrian Arab RepublicTajikistanTanzaniaThailandTimor-LesteTogoTongaTrinidad and TobagoTunisiaTurkeyUgandaUkraineUnited Arab EmiratesUnited KingdomUnited StatesUpper middle incomeUruguayVanuatuVenezuela, RBVietnamWest Bank and GazaWorldYemen, Rep.ZambiaZimbabwe Timeline:
This timeline shows a graph from 1961 to 2016 of Netherlands. No data until 1960. Number of actual observations by date: 53.
Source name:
World Development Indicators
Source organization:
International Monetary Fund, International Financial Statistics and data files, and World Bank and OECD GDP estimates.
Categories, topics:
Financial Sector, Private Sector
Last updated:
apr 23, 2017
Indicators value changes by year
Minimum:
18.445
jan 1, 1961
Maximum:
118.619
jan 1, 2010
At the date of observation
Value
Absolute change
Change from previous value
jan 1, 1961
18.445
+18.445
0.0%
jan 1, 1962
21.071
+2.626
14.24%
jan 1, 1963
23.422
+2.351
11.16%
jan 1, 1964
25.279
+1.857
7.93%
jan 1, 1965
25.378
+0.099
0.39%
jan 1, 1966
26.257
+0.879
3.46%
jan 1, 1967
27.26
+1.004
3.82%
jan 1, 1968
29.442
+2.181
8.0%
jan 1, 1969
31.14
+1.698
5.77%
jan 1, 1970
32.093
+0.953
3.06%
jan 1, 1971
30.988
-1.105
-3.44%
jan 1, 1972
31.29
+0.302
0.97%
jan 1, 1973
33.075
+1.785
5.71%
jan 1, 1974
36.4
+3.324
10.05%
jan 1, 1975
37.134
+0.734
2.02%
jan 1, 1976
38.865
+1.731
4.66%
jan 1, 1977
41.179
+2.313
5.95%
jan 1, 1978
47.953
+6.774
16.45%
jan 1, 1979
53.727
+5.774
12.04%
jan 1, 1980
57.719
+3.992
7.43%
jan 1, 1981
58.785
+1.066
1.85%
jan 1, 1982
58.745
-0.04
-0.07%
jan 1, 1983
58.245
-0.5
-0.85%
jan 1, 1984
58.109
-0.136
-0.23%
jan 1, 1985
57.176
-0.934
-1.61%
jan 1, 1986
57.619
+0.443
0.77%
jan 1, 1987
60.159
+2.54
4.41%
jan 1, 1988
62.816
+2.657
4.42%
jan 1, 1989
73.688
+10.872
17.31%
jan 1, 1990
74.262
+0.575
0.78%
jan 1, 1991
74.954
+0.691
0.93%
jan 1, 1992
76.503
+1.55
2.07%
jan 1, 1993
77.259
+0.755
0.99%
jan 1, 1994
80.121
+2.863
3.71%
jan 1, 1995
82.16
+2.038
2.54%
jan 1, 1996
87.478
+5.318
6.47%
jan 1, 1997
93.046
+5.568
6.37%
jan 1, 1998
98.074
+5.029
5.4%
jan 1, 2002
111.666
+13.592
13.86%
jan 1, 2003
110.651
-1.015
-0.91%
jan 1, 2004
110.133
-0.519
-0.47%
jan 1, 2005
113.965
+3.832
3.48%
jan 1, 2006
117.487
+3.522
3.09%
jan 1, 2007
114.563
-2.924
-2.49%
jan 1, 2008
114.463
-0.1
-0.09%
jan 1, 2009
112.311
-2.151
-1.88%
jan 1, 2010
118.619
+6.308
5.62%
jan 1, 2011
115.055
-3.564
-3.0%
jan 1, 2012
115.879
+0.824
0.72%
jan 1, 2013
118.206
+2.328
2.01%
jan 1, 2014
115.194
-3.012
-2.55%
jan 1, 2015
115.916
+0.721
0.63%
jan 1, 2016
111.498
-4.418
-3.81%
Ranking of countries by current statistics by years


Comments: