29
/
en
AIzaSyAYiBZKx7MnpbEhh9jyipgxe19OcubqV5w
April 1, 2024
63416
Afghanistan
AFG
true
2
1
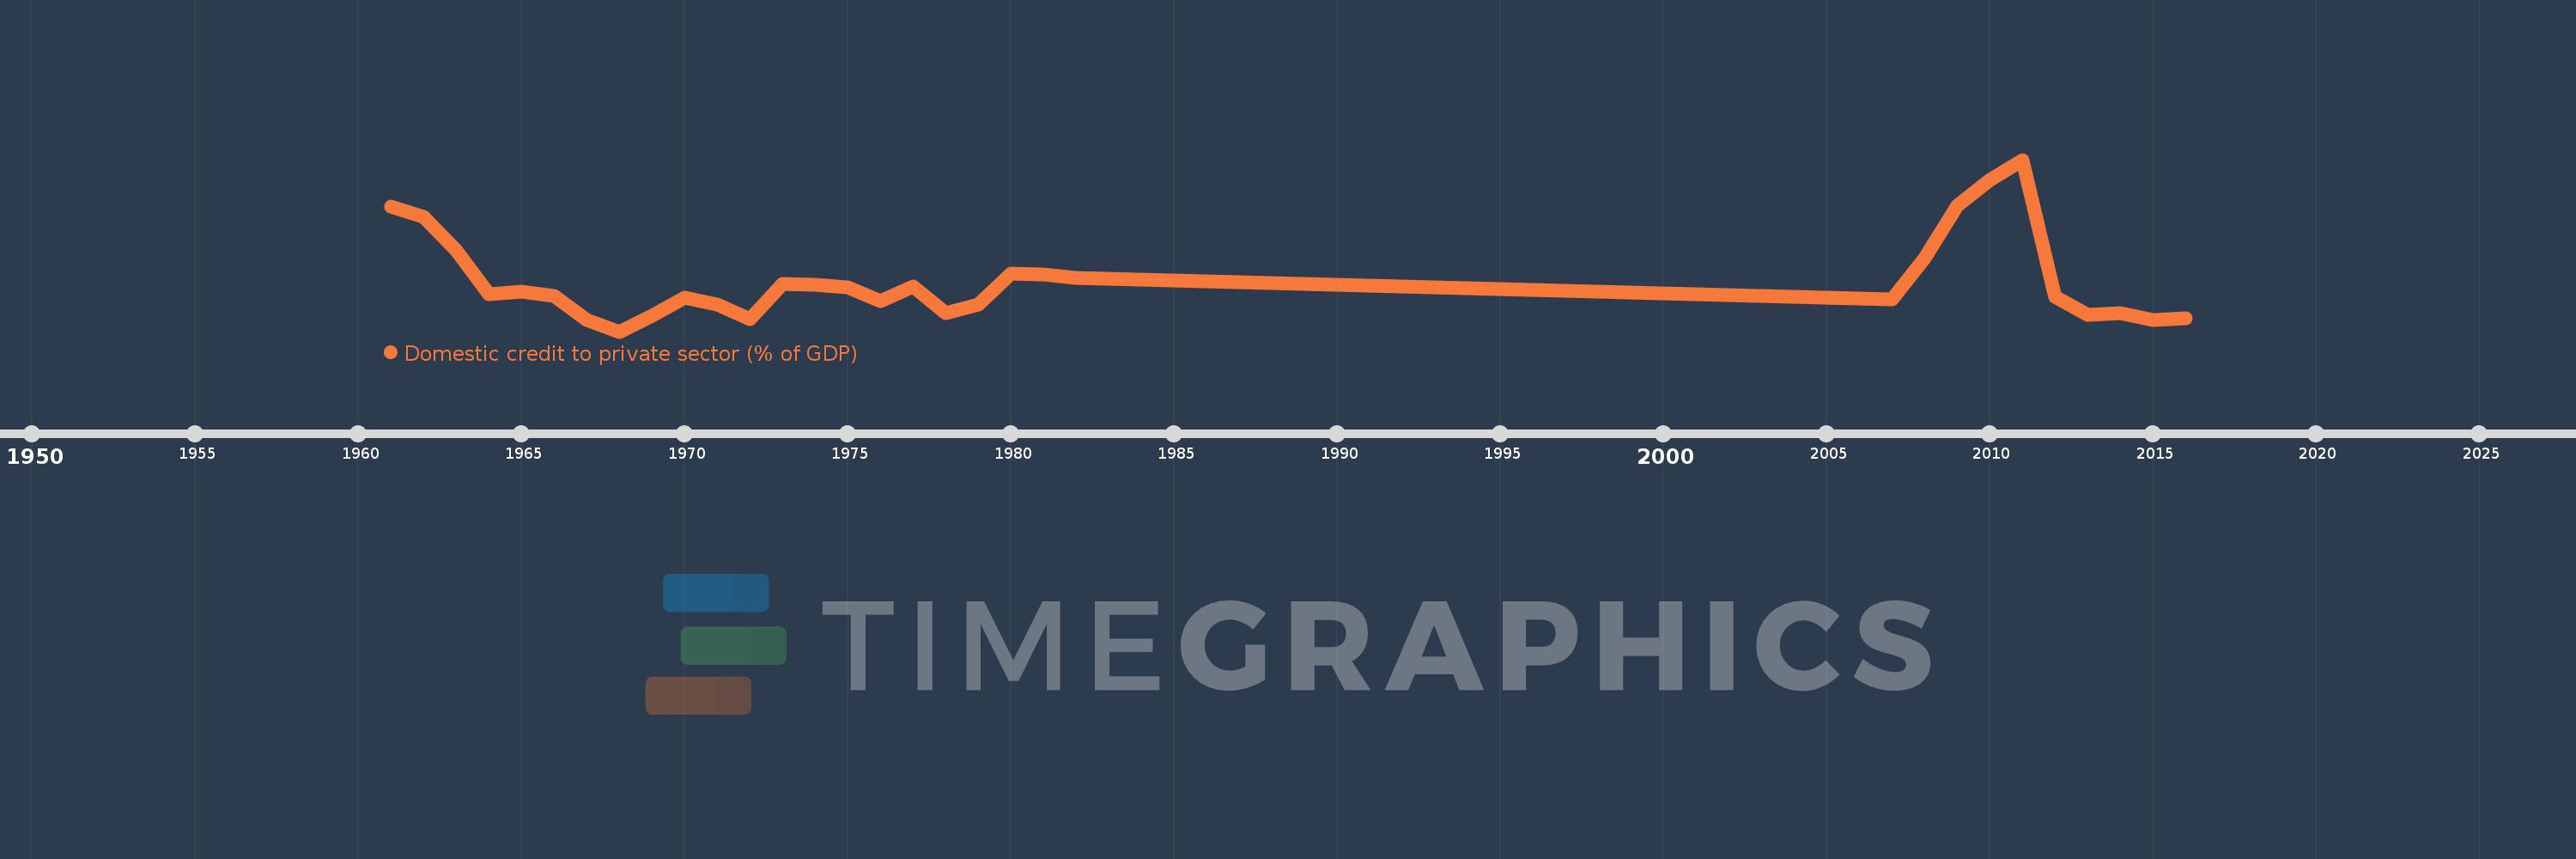
Domestic credit to private sector (% of GDP)
2016,2015,2014,2013,2012,2011,2010,2009,2008,2007,1982,1981,1980,1979,1978,1977,1976,1975,1974,1973,1972,1971,1970,1969,1968,1967,1966,1965,1964,1963,1962,1961
This statistics in other country:
AfghanistanAlbaniaAlgeriaAngolaAntigua and BarbudaArab WorldArgentinaArmeniaArubaAustraliaAustriaAzerbaijanBahamas, TheBahrainBangladeshBarbadosBelarusBelgiumBelizeBeninBhutanBoliviaBosnia and HerzegovinaBotswanaBrazilBrunei DarussalamBulgariaBurkina FasoBurundiCabo VerdeCambodiaCameroonCanadaCaribbean small statesCentral African RepublicCentral Europe and the BalticsChadChileChinaColombiaComorosCongo, Dem. Rep.Congo, Rep.Costa RicaCote d'IvoireCroatiaCyprusCzech RepublicDenmarkDjiboutiDominicaDominican RepublicEarly-demographic dividendEast Asia & PacificEast Asia & Pacific (excluding high income)East Asia & Pacific (IDA & IBRD countries)EcuadorEgypt, Arab Rep.El SalvadorEquatorial GuineaEritreaEstoniaEthiopiaEuro areaEurope & Central AsiaEurope & Central Asia (excluding high income)Europe & Central Asia (IDA & IBRD countries)European UnionFijiFinlandFragile and conflict affected situationsFranceGabonGambia, TheGeorgiaGermanyGhanaGreeceGrenadaGuatemalaGuineaGuinea-BissauGuyanaHaitiHeavily indebted poor countries (HIPC)High incomeHondurasHong Kong SAR, ChinaHungaryIBRD onlyIcelandIDA & IBRD totalIDA blendIDA onlyIDA totalIndiaIndonesiaIran, Islamic Rep.IraqIrelandIsraelItalyJamaicaJapanJordanKazakhstanKenyaKorea, Rep.KosovoKuwaitKyrgyz RepublicLao PDRLate-demographic dividendLatin America & Caribbean Latin America & Caribbean (excluding high income)Latin America & the Caribbean (IDA & IBRD countries)LatviaLeast developed countries: UN classificationLebanonLesothoLiberiaLibyaLithuaniaLow & middle incomeLow incomeLower middle incomeLuxembourgMacao SAR, ChinaMacedonia, FYRMadagascarMalawiMalaysiaMaldivesMaliMaltaMauritaniaMauritiusMexicoMicronesia, Fed. Sts.Middle East & North AfricaMiddle East & North Africa (excluding high income)Middle East & North Africa (IDA & IBRD countries)Middle incomeMoldovaMongoliaMontenegroMoroccoMozambiqueMyanmarNamibiaNepalNetherlandsNew ZealandNicaraguaNigerNigeriaNorth AmericaNorwayOECD membersOmanOther small statesPacific island small statesPakistanPanamaPapua New GuineaParaguayPeruPhilippinesPolandPortugalPost-demographic dividendPre-demographic dividendQatarRomaniaRussian FederationRwandaSamoaSao Tome and PrincipeSaudi ArabiaSenegalSerbiaSeychellesSierra LeoneSingaporeSlovak RepublicSloveniaSmall statesSolomon IslandsSouth AfricaSouth AsiaSouth Asia (IDA & IBRD)South SudanSpainSri LankaSt. Kitts and NevisSt. LuciaSt. Vincent and the GrenadinesSub-Saharan Africa Sub-Saharan Africa (excluding high income)Sub-Saharan Africa (IDA & IBRD countries)SudanSurinameSwazilandSwedenSwitzerlandSyrian Arab RepublicTajikistanTanzaniaThailandTimor-LesteTogoTongaTrinidad and TobagoTunisiaTurkeyUgandaUkraineUnited Arab EmiratesUnited KingdomUnited StatesUpper middle incomeUruguayVanuatuVenezuela, RBVietnamWest Bank and GazaWorldYemen, Rep.ZambiaZimbabwe Timeline:
This timeline shows a graph from 1961 to 2016 of Afghanistan. No data until 1960. Number of actual observations by date: 32.
Source name:
World Development Indicators
Source organization:
International Monetary Fund, International Financial Statistics and data files, and World Bank and OECD GDP estimates.
Categories, topics:
Financial Sector, Private Sector
Last updated:
apr 23, 2017
Indicators value changes by year
Maximum:
11.517
jan 1, 2011
At the date of observation
Value
Absolute change
Change from previous value
jan 1, 1961
9.273
+9.273
0.0%
jan 1, 1962
8.753
-0.52
-5.6%
jan 1, 1963
7.154
-1.599
-18.26%
jan 1, 1964
5.068
-2.086
-29.16%
jan 1, 1965
5.186
+0.118
2.33%
jan 1, 1966
4.971
-0.215
-4.14%
jan 1, 1967
3.802
-1.17
-23.53%
jan 1, 1968
3.252
-0.549
-14.45%
jan 1, 1969
4.027
+0.774
23.8%
jan 1, 1970
4.872
+0.845
20.99%
jan 1, 1971
4.553
-0.318
-6.54%
jan 1, 1972
3.833
-0.72
-15.81%
jan 1, 1973
5.546
+1.712
44.67%
jan 1, 1974
5.488
-0.058
-1.04%
jan 1, 1975
5.376
-0.112
-2.03%
jan 1, 1976
4.71
-0.666
-12.39%
jan 1, 1977
5.429
+0.719
15.26%
jan 1, 1978
4.134
-1.295
-23.86%
jan 1, 1979
4.559
+0.426
10.29%
jan 1, 1980
6.058
+1.499
32.87%
jan 1, 1981
5.98
-0.078
-1.29%
jan 1, 1982
5.838
-0.142
-2.37%
jan 1, 2007
4.784
-1.054
-18.05%
jan 1, 2008
6.77
+1.986
41.51%
jan 1, 2009
9.313
+2.543
37.56%
jan 1, 2010
10.526
+1.212
13.02%
jan 1, 2011
11.517
+0.991
9.42%
jan 1, 2012
4.929
-6.588
-57.2%
jan 1, 2013
4.054
-0.875
-17.75%
jan 1, 2014
4.131
+0.077
1.91%
jan 1, 2015
3.818
-0.313
-7.57%
jan 1, 2016
3.872
+0.053
1.4%
Ranking of countries by current statistics by years


Comments: