29
/
en
AIzaSyAYiBZKx7MnpbEhh9jyipgxe19OcubqV5w
April 1, 2024
103486
Chad
TCD
true
2
1
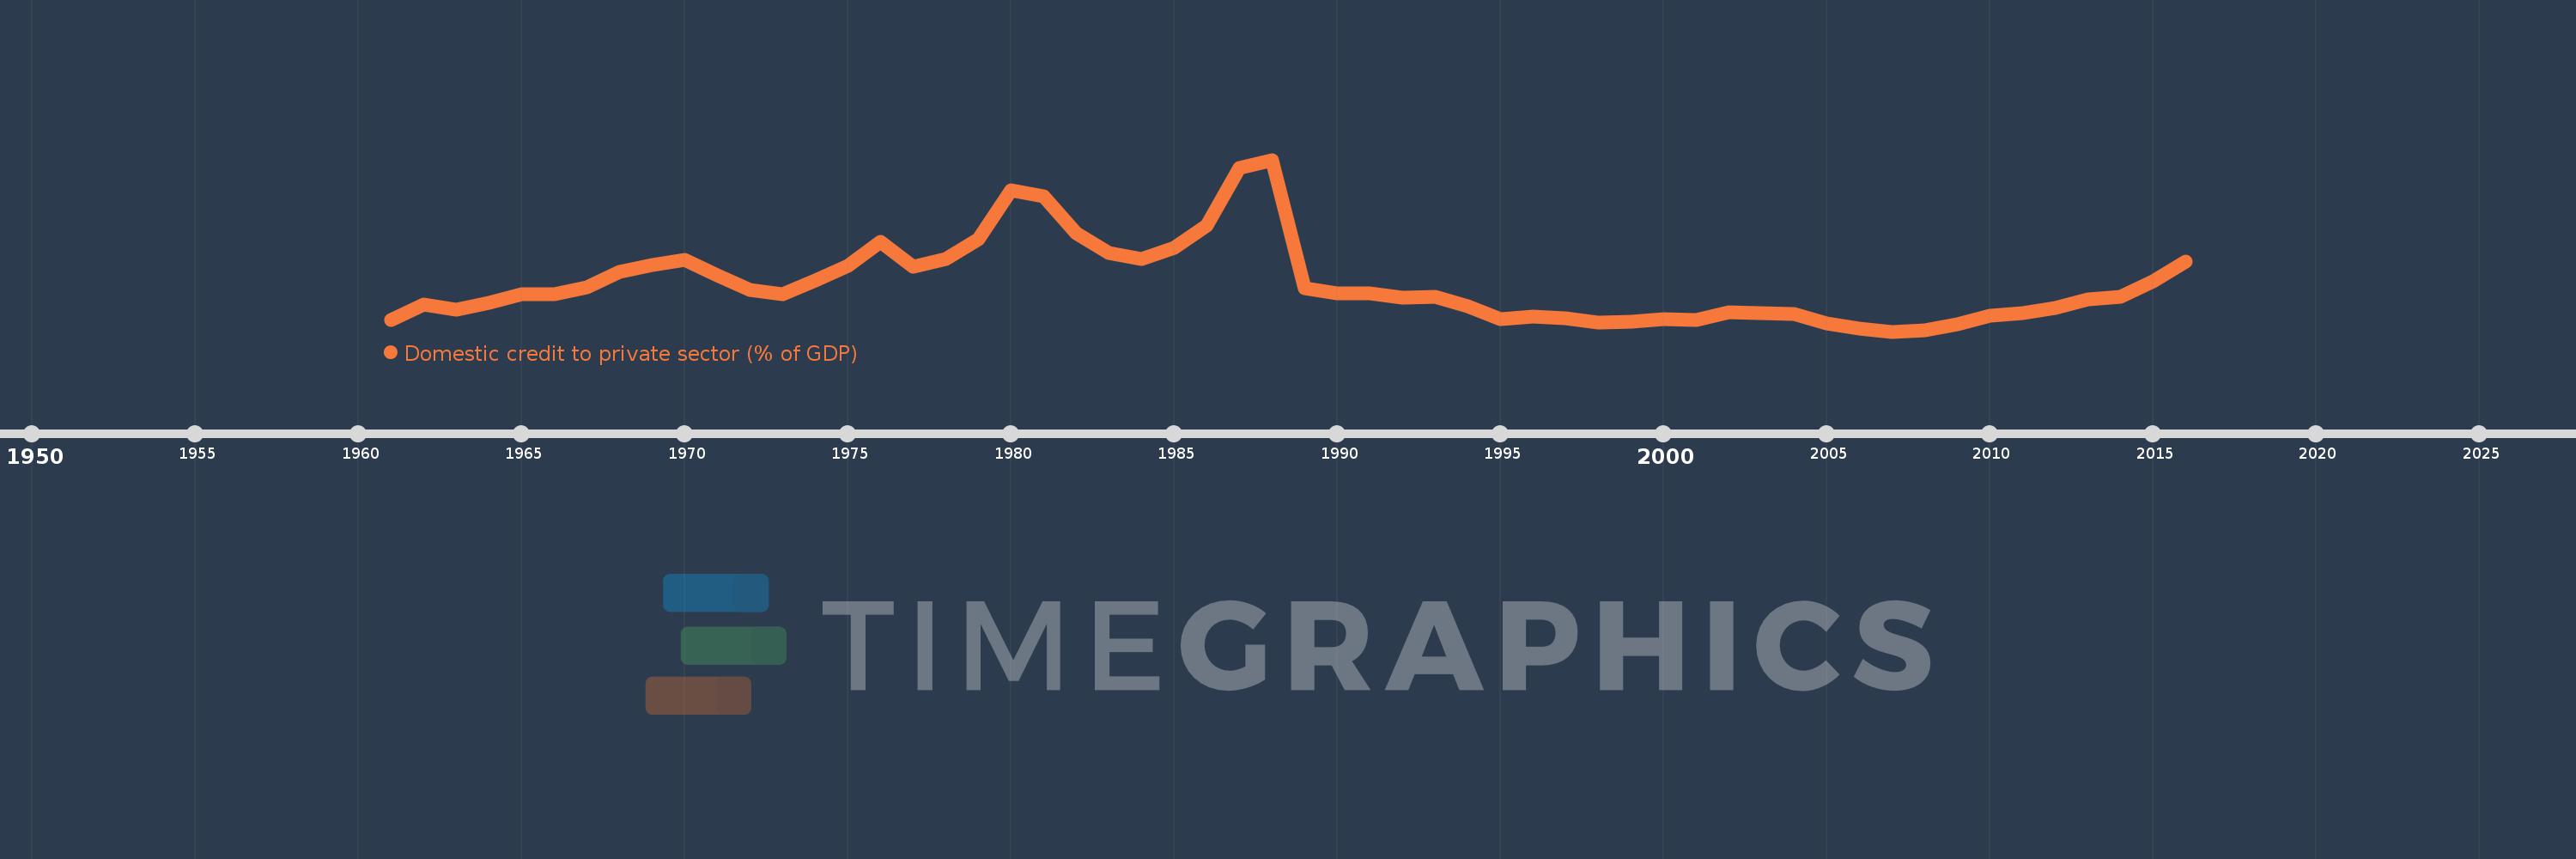
Domestic credit to private sector (% of GDP)
2016,2015,2014,2013,2012,2011,2010,2009,2008,2007,2006,2005,2004,2003,2002,2001,2000,1999,1998,1997,1996,1995,1994,1993,1992,1991,1990,1989,1988,1987,1986,1985,1984,1983,1982,1981,1980,1979,1978,1977,1976,1975,1974,1973,1972,1971,1970,1969,1968,1967,1966,1965,1964,1963,1962,1961
This statistics in other country:
AfghanistanAlbaniaAlgeriaAngolaAntigua and BarbudaArab WorldArgentinaArmeniaArubaAustraliaAustriaAzerbaijanBahamas, TheBahrainBangladeshBarbadosBelarusBelgiumBelizeBeninBhutanBoliviaBosnia and HerzegovinaBotswanaBrazilBrunei DarussalamBulgariaBurkina FasoBurundiCabo VerdeCambodiaCameroonCanadaCaribbean small statesCentral African RepublicCentral Europe and the BalticsChadChileChinaColombiaComorosCongo, Dem. Rep.Congo, Rep.Costa RicaCote d'IvoireCroatiaCyprusCzech RepublicDenmarkDjiboutiDominicaDominican RepublicEarly-demographic dividendEast Asia & PacificEast Asia & Pacific (excluding high income)East Asia & Pacific (IDA & IBRD countries)EcuadorEgypt, Arab Rep.El SalvadorEquatorial GuineaEritreaEstoniaEthiopiaEuro areaEurope & Central AsiaEurope & Central Asia (excluding high income)Europe & Central Asia (IDA & IBRD countries)European UnionFijiFinlandFragile and conflict affected situationsFranceGabonGambia, TheGeorgiaGermanyGhanaGreeceGrenadaGuatemalaGuineaGuinea-BissauGuyanaHaitiHeavily indebted poor countries (HIPC)High incomeHondurasHong Kong SAR, ChinaHungaryIBRD onlyIcelandIDA & IBRD totalIDA blendIDA onlyIDA totalIndiaIndonesiaIran, Islamic Rep.IraqIrelandIsraelItalyJamaicaJapanJordanKazakhstanKenyaKorea, Rep.KosovoKuwaitKyrgyz RepublicLao PDRLate-demographic dividendLatin America & Caribbean Latin America & Caribbean (excluding high income)Latin America & the Caribbean (IDA & IBRD countries)LatviaLeast developed countries: UN classificationLebanonLesothoLiberiaLibyaLithuaniaLow & middle incomeLow incomeLower middle incomeLuxembourgMacao SAR, ChinaMacedonia, FYRMadagascarMalawiMalaysiaMaldivesMaliMaltaMauritaniaMauritiusMexicoMicronesia, Fed. Sts.Middle East & North AfricaMiddle East & North Africa (excluding high income)Middle East & North Africa (IDA & IBRD countries)Middle incomeMoldovaMongoliaMontenegroMoroccoMozambiqueMyanmarNamibiaNepalNetherlandsNew ZealandNicaraguaNigerNigeriaNorth AmericaNorwayOECD membersOmanOther small statesPacific island small statesPakistanPanamaPapua New GuineaParaguayPeruPhilippinesPolandPortugalPost-demographic dividendPre-demographic dividendQatarRomaniaRussian FederationRwandaSamoaSao Tome and PrincipeSaudi ArabiaSenegalSerbiaSeychellesSierra LeoneSingaporeSlovak RepublicSloveniaSmall statesSolomon IslandsSouth AfricaSouth AsiaSouth Asia (IDA & IBRD)South SudanSpainSri LankaSt. Kitts and NevisSt. LuciaSt. Vincent and the GrenadinesSub-Saharan Africa Sub-Saharan Africa (excluding high income)Sub-Saharan Africa (IDA & IBRD countries)SudanSurinameSwazilandSwedenSwitzerlandSyrian Arab RepublicTajikistanTanzaniaThailandTimor-LesteTogoTongaTrinidad and TobagoTunisiaTurkeyUgandaUkraineUnited Arab EmiratesUnited KingdomUnited StatesUpper middle incomeUruguayVanuatuVenezuela, RBVietnamWest Bank and GazaWorldYemen, Rep.ZambiaZimbabwe Timeline:
This timeline shows a graph from 1961 to 2016 of Chad. No data until 1960. Number of actual observations by date: 56.
Source name:
World Development Indicators
Source organization:
International Monetary Fund, International Financial Statistics and data files, and World Bank and OECD GDP estimates.
Categories, topics:
Financial Sector, Private Sector
Last updated:
apr 23, 2017
Indicators value changes by year
Maximum:
21.214
jan 1, 1988
At the date of observation
Value
Absolute change
Change from previous value
jan 1, 1961
3.499
+3.499
0.0%
jan 1, 1962
5.201
+1.702
48.66%
jan 1, 1963
4.599
-0.602
-11.57%
jan 1, 1964
5.39
+0.791
17.2%
jan 1, 1965
6.357
+0.967
17.94%
jan 1, 1966
6.362
+0.005
0.07%
jan 1, 1967
7.119
+0.758
11.91%
jan 1, 1968
8.811
+1.692
23.76%
jan 1, 1969
9.606
+0.795
9.02%
jan 1, 1970
10.174
+0.568
5.91%
jan 1, 1971
8.454
-1.72
-16.9%
jan 1, 1972
6.809
-1.645
-19.46%
jan 1, 1973
6.386
-0.423
-6.22%
jan 1, 1974
7.824
+1.438
22.52%
jan 1, 1975
9.449
+1.625
20.77%
jan 1, 1976
12.096
+2.647
28.01%
jan 1, 1977
9.351
-2.744
-22.69%
jan 1, 1978
10.268
+0.916
9.8%
jan 1, 1979
12.414
+2.146
20.9%
jan 1, 1980
17.868
+5.454
43.94%
jan 1, 1981
17.172
-0.696
-3.9%
jan 1, 1982
13.119
-4.054
-23.6%
jan 1, 1983
10.938
-2.18
-16.62%
jan 1, 1984
10.232
-0.707
-6.46%
jan 1, 1985
11.437
+1.205
11.78%
jan 1, 1986
13.994
+2.558
22.36%
jan 1, 1987
20.283
+6.288
44.94%
jan 1, 1988
21.214
+0.931
4.59%
jan 1, 1989
7.036
-14.178
-66.83%
jan 1, 1990
6.431
-0.605
-8.6%
jan 1, 1991
6.481
+0.05
0.78%
jan 1, 1992
5.948
-0.533
-8.22%
jan 1, 1993
6.088
+0.139
2.34%
jan 1, 1994
5.035
-1.053
-17.3%
jan 1, 1995
3.626
-1.409
-27.98%
jan 1, 1996
3.85
+0.225
6.2%
jan 1, 1997
3.642
-0.208
-5.4%
jan 1, 1998
3.234
-0.408
-11.21%
jan 1, 1999
3.306
+0.072
2.23%
jan 1, 2000
3.586
+0.28
8.46%
jan 1, 2001
3.479
-0.107
-2.98%
jan 1, 2002
4.338
+0.859
24.69%
jan 1, 2003
4.212
-0.126
-2.91%
jan 1, 2004
4.195
-0.017
-0.41%
jan 1, 2005
3.134
-1.061
-25.3%
jan 1, 2006
2.542
-0.592
-18.89%
jan 1, 2007
2.215
-0.326
-12.84%
jan 1, 2008
2.398
+0.182
8.23%
jan 1, 2009
3.062
+0.665
27.71%
jan 1, 2010
3.931
+0.869
28.37%
jan 1, 2011
4.237
+0.306
7.78%
jan 1, 2012
4.849
+0.612
14.44%
jan 1, 2013
5.817
+0.969
19.98%
jan 1, 2014
6.089
+0.272
4.67%
jan 1, 2015
7.802
+1.712
28.12%
jan 1, 2016
9.994
+2.193
28.11%
Ranking of countries by current statistics by years


Comments: