29
/
en
AIzaSyAYiBZKx7MnpbEhh9jyipgxe19OcubqV5w
April 1, 2024
110806
Congo, Rep.
COG
true
2
1
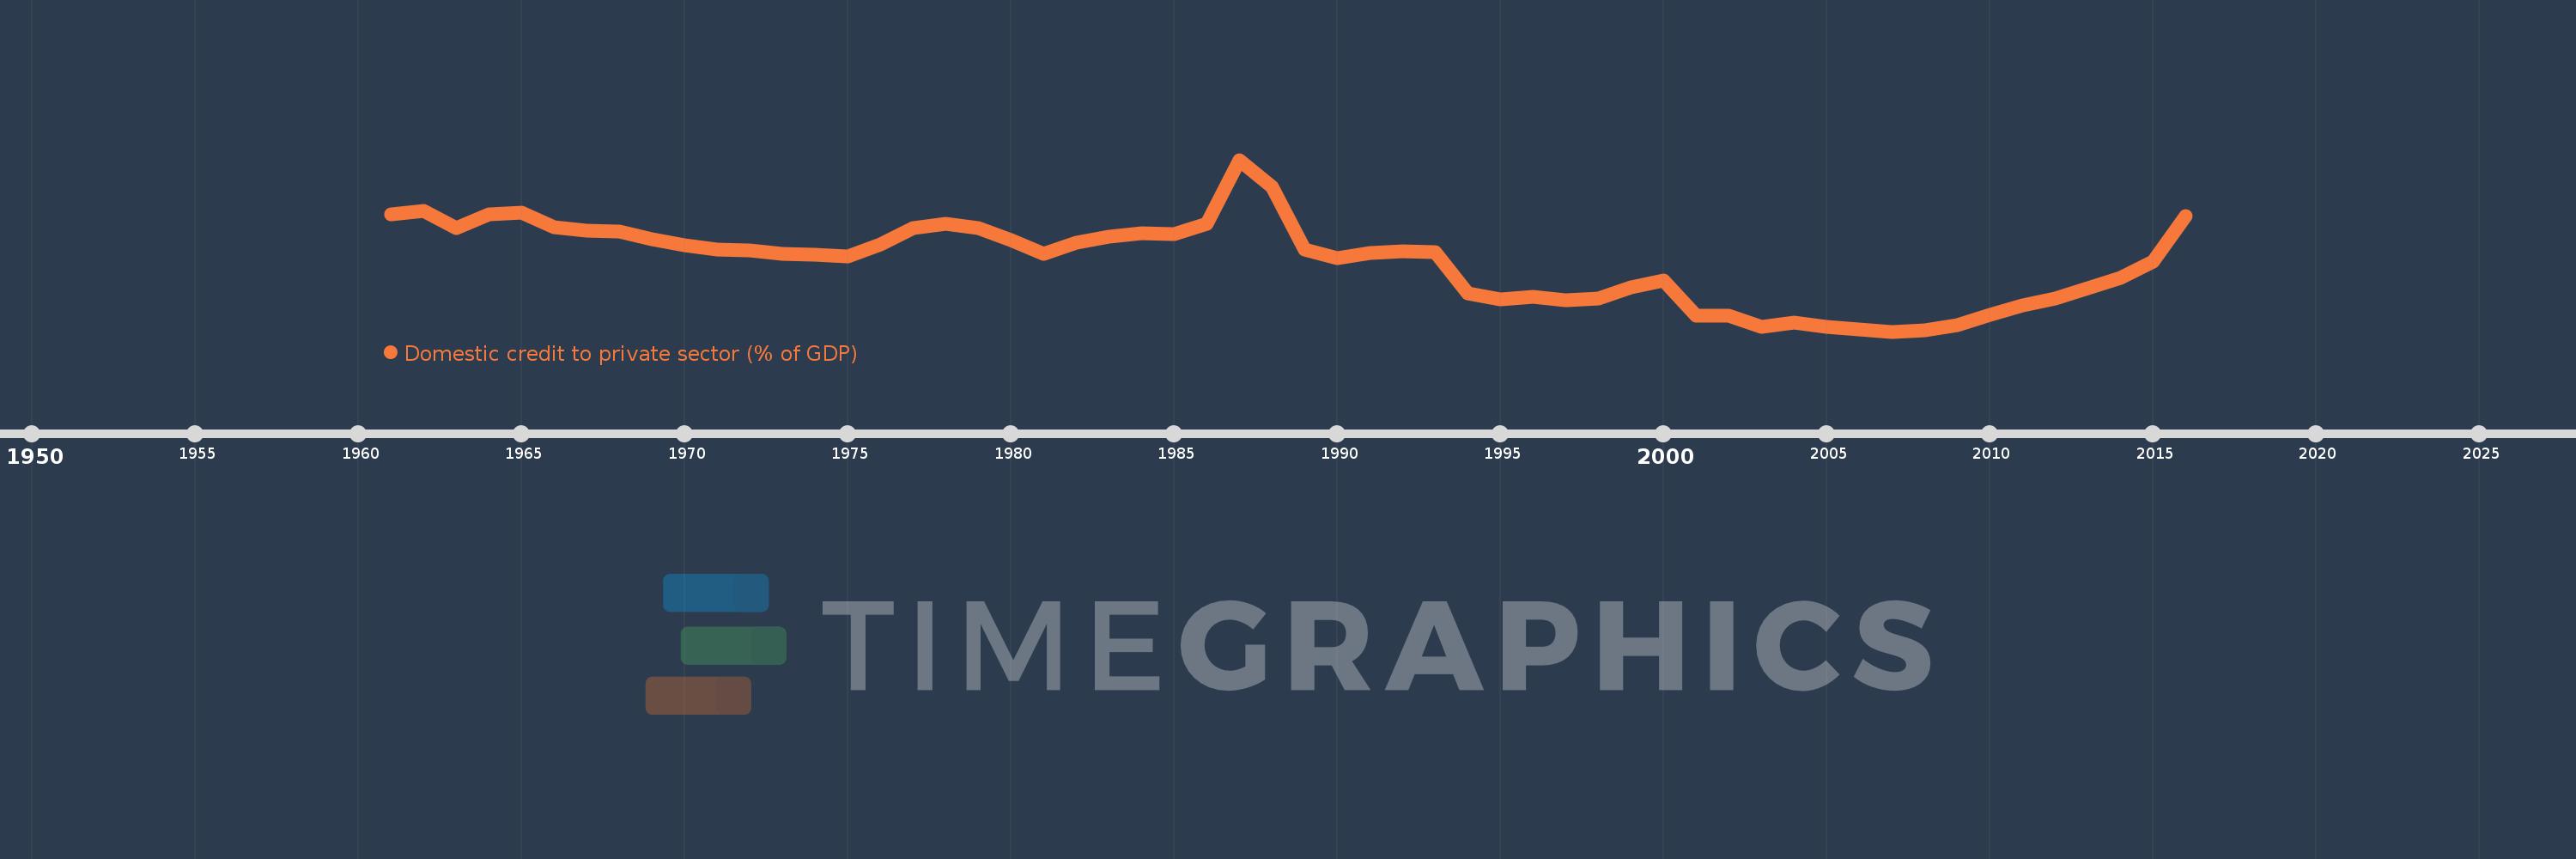
Domestic credit to private sector (% of GDP)
2016,2015,2014,2013,2012,2011,2010,2009,2008,2007,2006,2005,2004,2003,2002,2001,2000,1999,1998,1997,1996,1995,1994,1993,1992,1991,1990,1989,1988,1987,1986,1985,1984,1983,1982,1981,1980,1979,1978,1977,1976,1975,1974,1973,1972,1971,1970,1969,1968,1967,1966,1965,1964,1963,1962,1961
This statistics in other country:
AfghanistanAlbaniaAlgeriaAngolaAntigua and BarbudaArab WorldArgentinaArmeniaArubaAustraliaAustriaAzerbaijanBahamas, TheBahrainBangladeshBarbadosBelarusBelgiumBelizeBeninBhutanBoliviaBosnia and HerzegovinaBotswanaBrazilBrunei DarussalamBulgariaBurkina FasoBurundiCabo VerdeCambodiaCameroonCanadaCaribbean small statesCentral African RepublicCentral Europe and the BalticsChadChileChinaColombiaComorosCongo, Dem. Rep.Congo, Rep.Costa RicaCote d'IvoireCroatiaCyprusCzech RepublicDenmarkDjiboutiDominicaDominican RepublicEarly-demographic dividendEast Asia & PacificEast Asia & Pacific (excluding high income)East Asia & Pacific (IDA & IBRD countries)EcuadorEgypt, Arab Rep.El SalvadorEquatorial GuineaEritreaEstoniaEthiopiaEuro areaEurope & Central AsiaEurope & Central Asia (excluding high income)Europe & Central Asia (IDA & IBRD countries)European UnionFijiFinlandFragile and conflict affected situationsFranceGabonGambia, TheGeorgiaGermanyGhanaGreeceGrenadaGuatemalaGuineaGuinea-BissauGuyanaHaitiHeavily indebted poor countries (HIPC)High incomeHondurasHong Kong SAR, ChinaHungaryIBRD onlyIcelandIDA & IBRD totalIDA blendIDA onlyIDA totalIndiaIndonesiaIran, Islamic Rep.IraqIrelandIsraelItalyJamaicaJapanJordanKazakhstanKenyaKorea, Rep.KosovoKuwaitKyrgyz RepublicLao PDRLate-demographic dividendLatin America & Caribbean Latin America & Caribbean (excluding high income)Latin America & the Caribbean (IDA & IBRD countries)LatviaLeast developed countries: UN classificationLebanonLesothoLiberiaLibyaLithuaniaLow & middle incomeLow incomeLower middle incomeLuxembourgMacao SAR, ChinaMacedonia, FYRMadagascarMalawiMalaysiaMaldivesMaliMaltaMauritaniaMauritiusMexicoMicronesia, Fed. Sts.Middle East & North AfricaMiddle East & North Africa (excluding high income)Middle East & North Africa (IDA & IBRD countries)Middle incomeMoldovaMongoliaMontenegroMoroccoMozambiqueMyanmarNamibiaNepalNetherlandsNew ZealandNicaraguaNigerNigeriaNorth AmericaNorwayOECD membersOmanOther small statesPacific island small statesPakistanPanamaPapua New GuineaParaguayPeruPhilippinesPolandPortugalPost-demographic dividendPre-demographic dividendQatarRomaniaRussian FederationRwandaSamoaSao Tome and PrincipeSaudi ArabiaSenegalSerbiaSeychellesSierra LeoneSingaporeSlovak RepublicSloveniaSmall statesSolomon IslandsSouth AfricaSouth AsiaSouth Asia (IDA & IBRD)South SudanSpainSri LankaSt. Kitts and NevisSt. LuciaSt. Vincent and the GrenadinesSub-Saharan Africa Sub-Saharan Africa (excluding high income)Sub-Saharan Africa (IDA & IBRD countries)SudanSurinameSwazilandSwedenSwitzerlandSyrian Arab RepublicTajikistanTanzaniaThailandTimor-LesteTogoTongaTrinidad and TobagoTunisiaTurkeyUgandaUkraineUnited Arab EmiratesUnited KingdomUnited StatesUpper middle incomeUruguayVanuatuVenezuela, RBVietnamWest Bank and GazaWorldYemen, Rep.ZambiaZimbabwe Timeline:
This timeline shows a graph from 1961 to 2016 of Congo, Rep.. No data until 1960. Number of actual observations by date: 56.
Source name:
World Development Indicators
Source organization:
International Monetary Fund, International Financial Statistics and data files, and World Bank and OECD GDP estimates.
Categories, topics:
Financial Sector, Private Sector
Last updated:
apr 23, 2017
Indicators value changes by year
At the date of observation
Value
Absolute change
Change from previous value
jan 1, 1961
22.229
+22.229
0.0%
jan 1, 1962
22.823
+0.593
2.67%
jan 1, 1963
19.853
-2.97
-13.01%
jan 1, 1964
22.322
+2.469
12.44%
jan 1, 1965
22.615
+0.293
1.31%
jan 1, 1966
20.123
-2.492
-11.02%
jan 1, 1967
19.465
-0.659
-3.27%
jan 1, 1968
19.281
-0.184
-0.95%
jan 1, 1969
18.053
-1.228
-6.37%
jan 1, 1970
16.925
-1.129
-6.25%
jan 1, 1971
16.286
-0.639
-3.78%
jan 1, 1972
16.069
-0.217
-1.33%
jan 1, 1973
15.515
-0.554
-3.45%
jan 1, 1974
15.315
-0.2
-1.29%
jan 1, 1975
15.092
-0.224
-1.46%
jan 1, 1976
17.174
+2.082
13.8%
jan 1, 1977
19.871
+2.697
15.71%
jan 1, 1978
20.707
+0.836
4.21%
jan 1, 1979
19.879
-0.827
-4.0%
jan 1, 1980
17.877
-2.002
-10.07%
jan 1, 1981
15.537
-2.34
-13.09%
jan 1, 1982
17.39
+1.853
11.93%
jan 1, 1983
18.472
+1.082
6.22%
jan 1, 1984
19.013
+0.54
2.93%
jan 1, 1985
18.837
-0.176
-0.92%
jan 1, 1986
20.73
+1.892
10.05%
jan 1, 1987
31.68
+10.95
52.82%
jan 1, 1988
27.067
-4.613
-14.56%
jan 1, 1989
16.24
-10.827
-40.0%
jan 1, 1990
14.734
-1.506
-9.28%
jan 1, 1991
15.692
+0.958
6.5%
jan 1, 1992
15.997
+0.304
1.94%
jan 1, 1993
15.756
-0.24
-1.5%
jan 1, 1994
8.686
-7.071
-44.87%
jan 1, 1995
7.698
-0.988
-11.37%
jan 1, 1996
8.112
+0.414
5.38%
jan 1, 1997
7.547
-0.565
-6.97%
jan 1, 1998
7.858
+0.311
4.11%
jan 1, 1999
9.739
+1.881
23.94%
jan 1, 2000
10.902
+1.163
11.94%
jan 1, 2001
4.781
-6.121
-56.15%
jan 1, 2002
4.897
+0.117
2.44%
jan 1, 2003
2.866
-2.031
-41.48%
jan 1, 2004
3.636
+0.77
26.86%
jan 1, 2005
2.933
-0.703
-19.34%
jan 1, 2006
2.414
-0.519
-17.69%
jan 1, 2007
2.097
-0.317
-13.12%
jan 1, 2008
2.267
+0.17
8.11%
jan 1, 2009
3.144
+0.877
38.66%
jan 1, 2010
4.918
+1.774
56.44%
jan 1, 2011
6.541
+1.623
33.0%
jan 1, 2012
7.77
+1.229
18.79%
jan 1, 2013
9.589
+1.819
23.41%
jan 1, 2014
11.317
+1.727
18.01%
jan 1, 2015
14.087
+2.77
24.48%
jan 1, 2016
22.056
+7.97
56.58%
Ranking of countries by current statistics by years


Comments: