29
/
en
AIzaSyAYiBZKx7MnpbEhh9jyipgxe19OcubqV5w
April 1, 2024
89669
Botswana
BWA
true
2
1
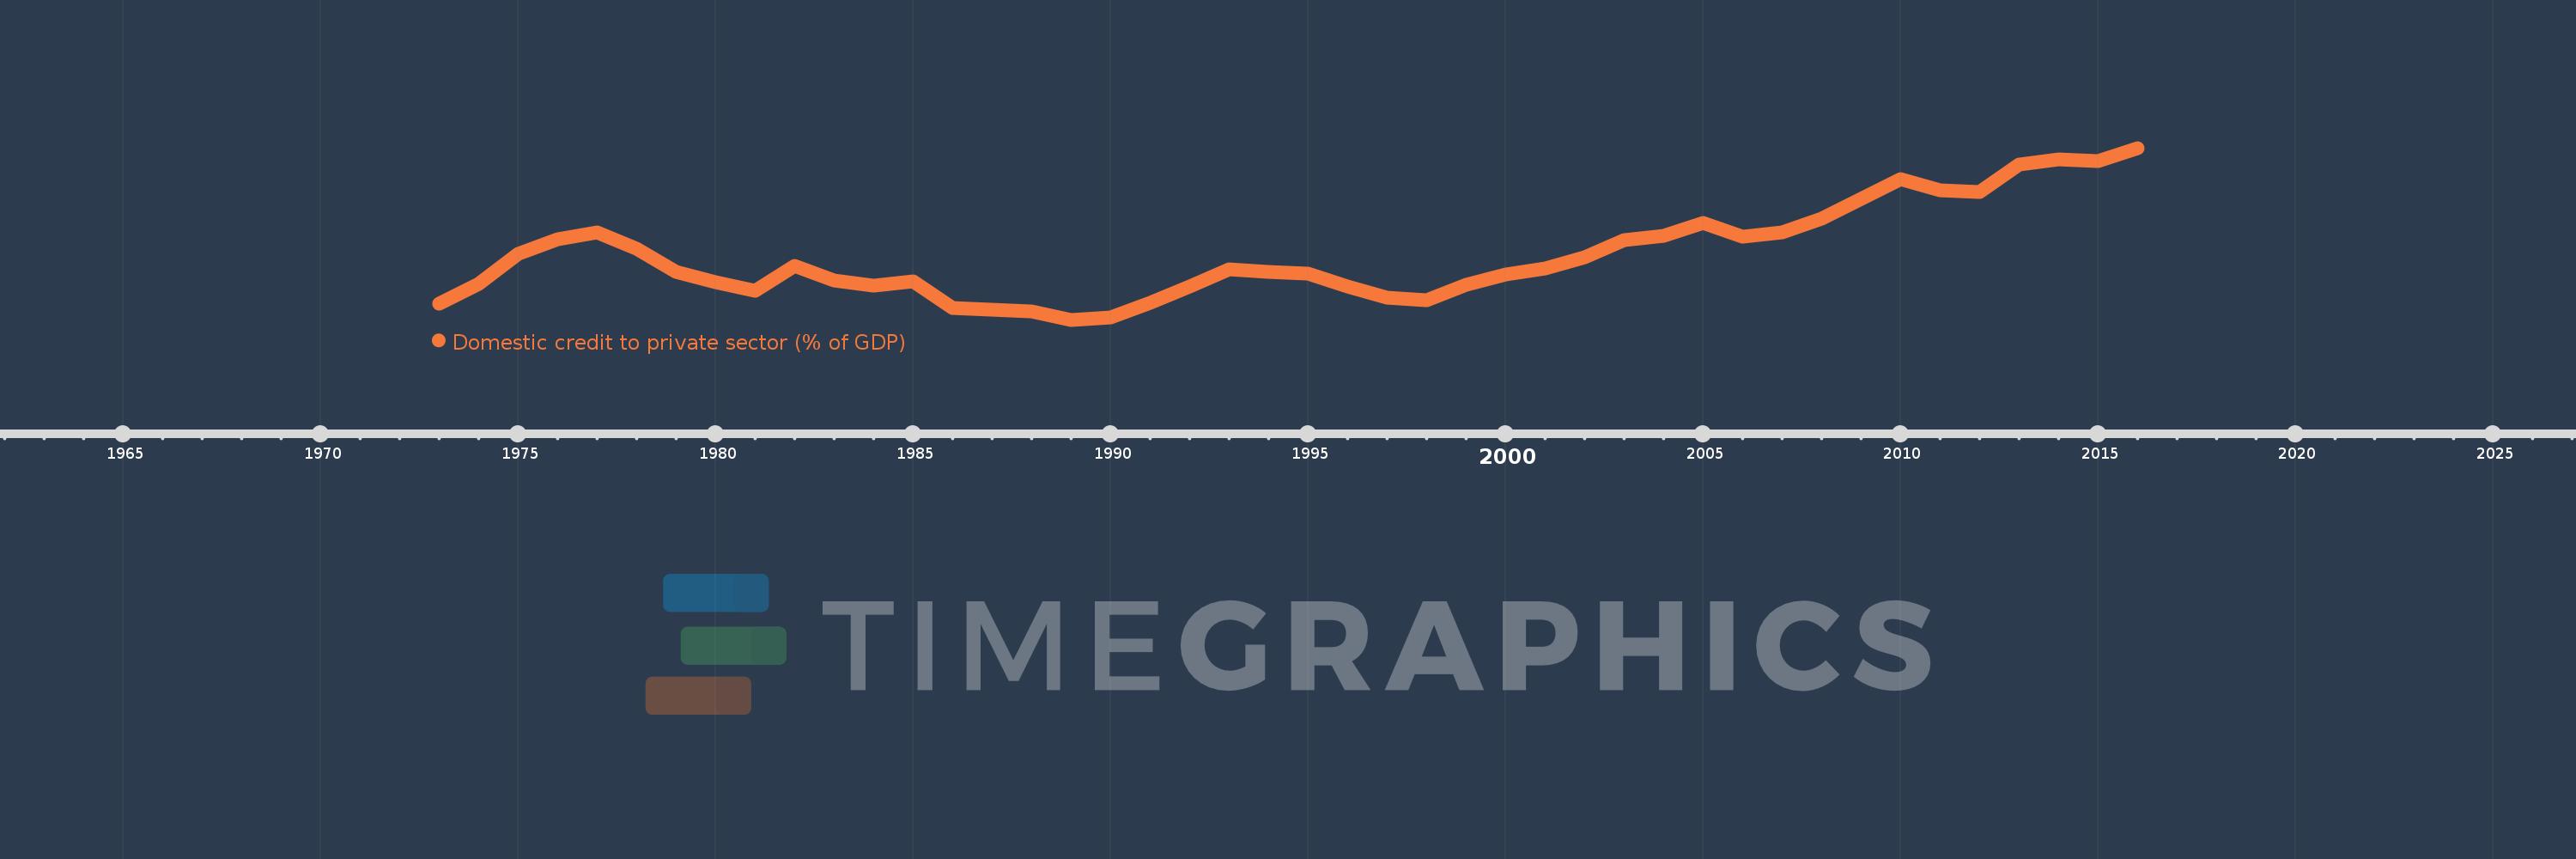
Domestic credit to private sector (% of GDP)
2016,2015,2014,2013,2012,2011,2010,2009,2008,2007,2006,2005,2004,2003,2002,2001,2000,1999,1998,1997,1996,1995,1994,1993,1992,1991,1990,1989,1988,1987,1986,1985,1984,1983,1982,1981,1980,1979,1978,1977,1976,1975,1974,1973
This statistics in other country:
AfghanistanAlbaniaAlgeriaAngolaAntigua and BarbudaArab WorldArgentinaArmeniaArubaAustraliaAustriaAzerbaijanBahamas, TheBahrainBangladeshBarbadosBelarusBelgiumBelizeBeninBhutanBoliviaBosnia and HerzegovinaBotswanaBrazilBrunei DarussalamBulgariaBurkina FasoBurundiCabo VerdeCambodiaCameroonCanadaCaribbean small statesCentral African RepublicCentral Europe and the BalticsChadChileChinaColombiaComorosCongo, Dem. Rep.Congo, Rep.Costa RicaCote d'IvoireCroatiaCyprusCzech RepublicDenmarkDjiboutiDominicaDominican RepublicEarly-demographic dividendEast Asia & PacificEast Asia & Pacific (excluding high income)East Asia & Pacific (IDA & IBRD countries)EcuadorEgypt, Arab Rep.El SalvadorEquatorial GuineaEritreaEstoniaEthiopiaEuro areaEurope & Central AsiaEurope & Central Asia (excluding high income)Europe & Central Asia (IDA & IBRD countries)European UnionFijiFinlandFragile and conflict affected situationsFranceGabonGambia, TheGeorgiaGermanyGhanaGreeceGrenadaGuatemalaGuineaGuinea-BissauGuyanaHaitiHeavily indebted poor countries (HIPC)High incomeHondurasHong Kong SAR, ChinaHungaryIBRD onlyIcelandIDA & IBRD totalIDA blendIDA onlyIDA totalIndiaIndonesiaIran, Islamic Rep.IraqIrelandIsraelItalyJamaicaJapanJordanKazakhstanKenyaKorea, Rep.KosovoKuwaitKyrgyz RepublicLao PDRLate-demographic dividendLatin America & Caribbean Latin America & Caribbean (excluding high income)Latin America & the Caribbean (IDA & IBRD countries)LatviaLeast developed countries: UN classificationLebanonLesothoLiberiaLibyaLithuaniaLow & middle incomeLow incomeLower middle incomeLuxembourgMacao SAR, ChinaMacedonia, FYRMadagascarMalawiMalaysiaMaldivesMaliMaltaMauritaniaMauritiusMexicoMicronesia, Fed. Sts.Middle East & North AfricaMiddle East & North Africa (excluding high income)Middle East & North Africa (IDA & IBRD countries)Middle incomeMoldovaMongoliaMontenegroMoroccoMozambiqueMyanmarNamibiaNepalNetherlandsNew ZealandNicaraguaNigerNigeriaNorth AmericaNorwayOECD membersOmanOther small statesPacific island small statesPakistanPanamaPapua New GuineaParaguayPeruPhilippinesPolandPortugalPost-demographic dividendPre-demographic dividendQatarRomaniaRussian FederationRwandaSamoaSao Tome and PrincipeSaudi ArabiaSenegalSerbiaSeychellesSierra LeoneSingaporeSlovak RepublicSloveniaSmall statesSolomon IslandsSouth AfricaSouth AsiaSouth Asia (IDA & IBRD)South SudanSpainSri LankaSt. Kitts and NevisSt. LuciaSt. Vincent and the GrenadinesSub-Saharan Africa Sub-Saharan Africa (excluding high income)Sub-Saharan Africa (IDA & IBRD countries)SudanSurinameSwazilandSwedenSwitzerlandSyrian Arab RepublicTajikistanTanzaniaThailandTimor-LesteTogoTongaTrinidad and TobagoTunisiaTurkeyUgandaUkraineUnited Arab EmiratesUnited KingdomUnited StatesUpper middle incomeUruguayVanuatuVenezuela, RBVietnamWest Bank and GazaWorldYemen, Rep.ZambiaZimbabwe Timeline:
This timeline shows a graph from 1973 to 2016 of Botswana. No data until 1972. Number of actual observations by date: 44.
Source name:
World Development Indicators
Source organization:
International Monetary Fund, International Financial Statistics and data files, and World Bank and OECD GDP estimates.
Categories, topics:
Financial Sector, Private Sector
Last updated:
apr 23, 2017
Indicators value changes by year
Maximum:
33.855
jan 1, 2016
At the date of observation
Value
Absolute change
Change from previous value
jan 1, 1973
9.141
+9.141
0.0%
jan 1, 1974
12.363
+3.222
35.25%
jan 1, 1975
17.116
+4.753
38.44%
jan 1, 1976
19.323
+2.208
12.9%
jan 1, 1977
20.492
+1.169
6.05%
jan 1, 1978
17.855
-2.637
-12.87%
jan 1, 1979
14.214
-3.642
-20.4%
jan 1, 1980
12.641
-1.573
-11.06%
jan 1, 1981
11.29
-1.351
-10.69%
jan 1, 1982
15.116
+3.827
33.9%
jan 1, 1983
12.881
-2.236
-14.79%
jan 1, 1984
12.026
-0.855
-6.64%
jan 1, 1985
12.666
+0.641
5.33%
jan 1, 1986
8.558
-4.108
-32.43%
jan 1, 1987
8.297
-0.261
-3.05%
jan 1, 1988
7.922
-0.375
-4.52%
jan 1, 1989
6.64
-1.282
-16.18%
jan 1, 1990
7.004
+0.364
5.48%
jan 1, 1991
9.385
+2.38
33.98%
jan 1, 1992
11.859
+2.475
26.37%
jan 1, 1993
14.687
+2.828
23.85%
jan 1, 1994
14.228
-0.459
-3.13%
jan 1, 1995
13.99
-0.238
-1.67%
jan 1, 1996
11.893
-2.097
-14.99%
jan 1, 1997
10.09
-1.803
-15.16%
jan 1, 1998
9.686
-0.405
-4.01%
jan 1, 1999
12.156
+2.47
25.51%
jan 1, 2000
13.873
+1.717
14.13%
jan 1, 2001
14.711
+0.838
6.04%
jan 1, 2002
16.586
+1.875
12.75%
jan 1, 2003
19.28
+2.694
16.24%
jan 1, 2004
19.977
+0.697
3.62%
jan 1, 2005
21.936
+1.958
9.8%
jan 1, 2006
19.764
-2.172
-9.9%
jan 1, 2007
20.484
+0.721
3.65%
jan 1, 2008
22.664
+2.18
10.64%
jan 1, 2009
25.787
+3.123
13.78%
jan 1, 2010
28.931
+3.144
12.19%
jan 1, 2011
27.194
-1.738
-6.01%
jan 1, 2012
26.837
-0.356
-1.31%
jan 1, 2013
31.253
+4.416
16.45%
jan 1, 2014
32.008
+0.755
2.42%
jan 1, 2015
31.759
-0.249
-0.78%
jan 1, 2016
33.855
+2.096
6.6%
Ranking of countries by current statistics by years


Comments: