29
/
en
AIzaSyAYiBZKx7MnpbEhh9jyipgxe19OcubqV5w
April 1, 2024
76044
Bahamas, The
BHS
true
2
1
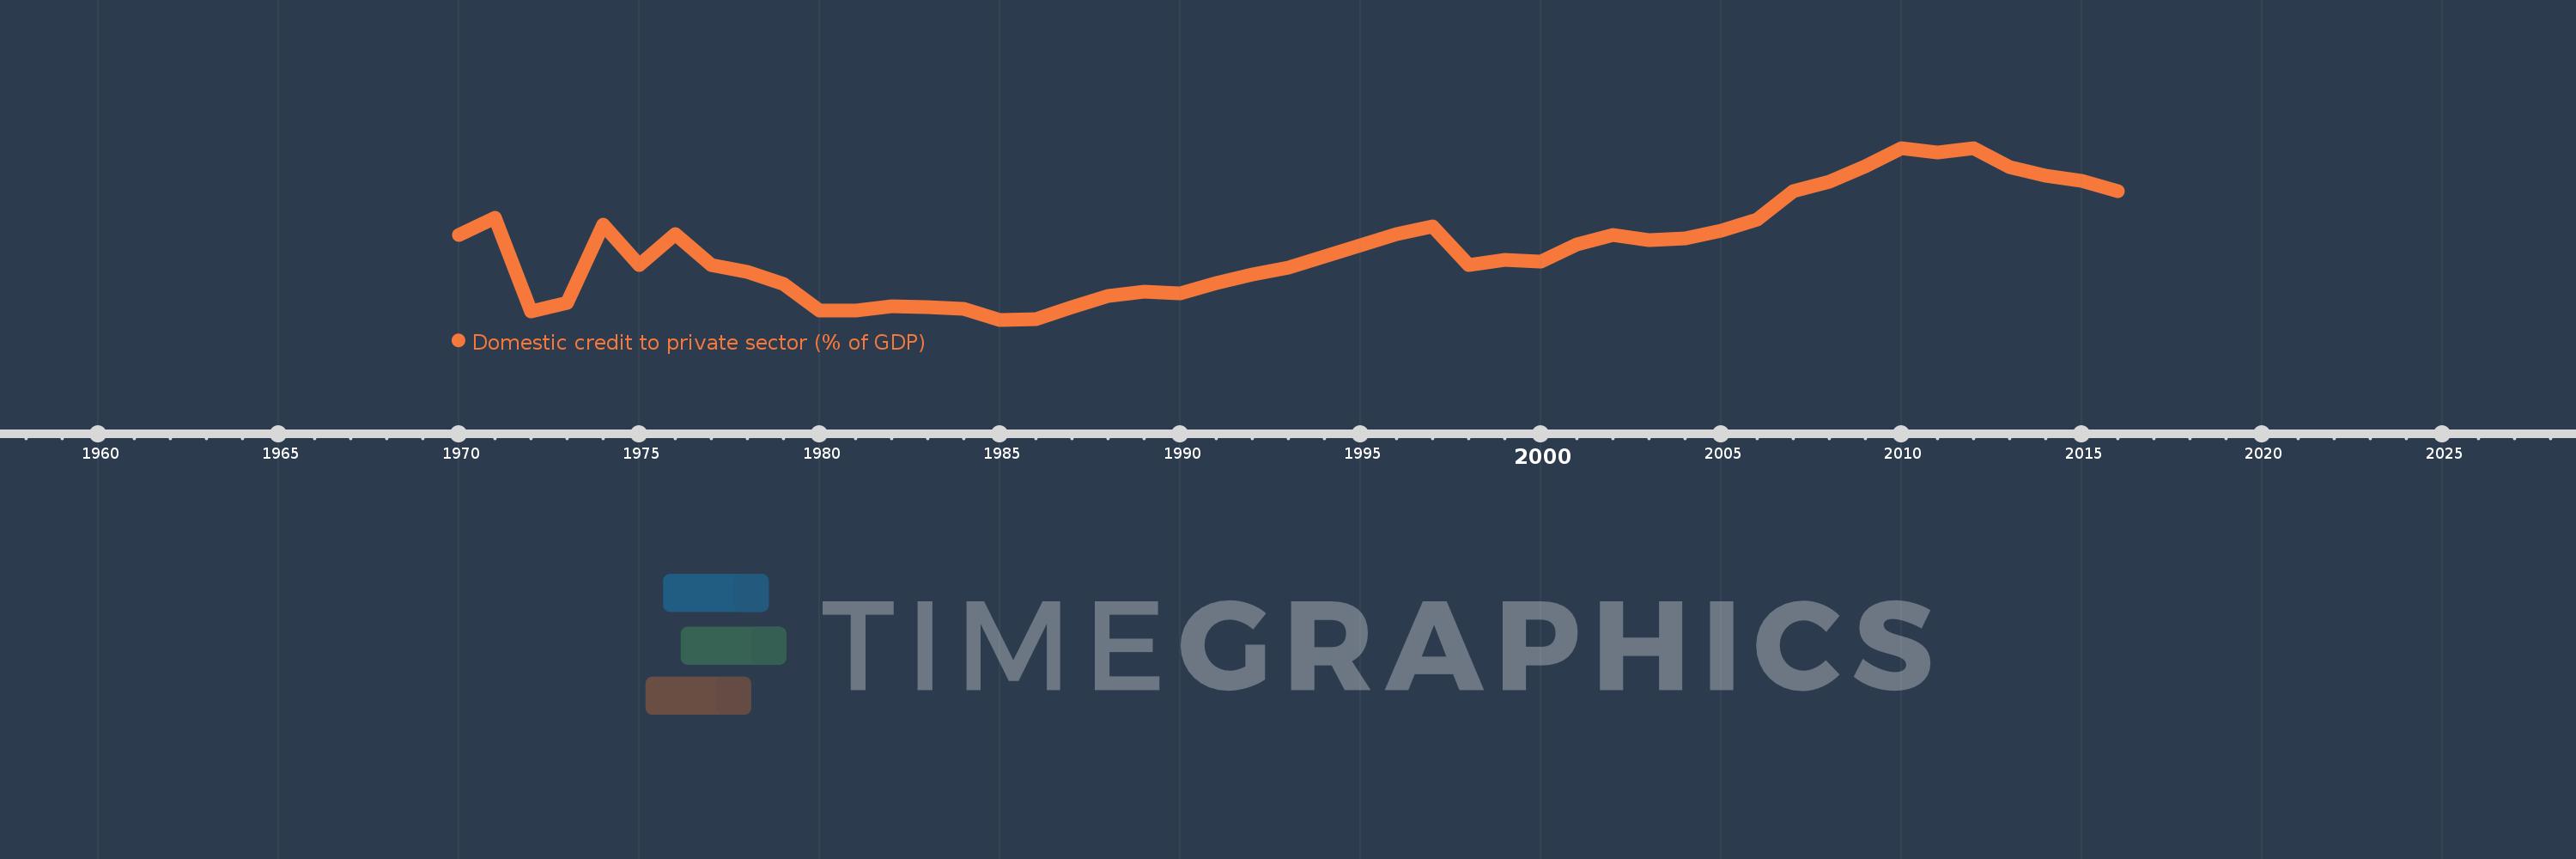
Domestic credit to private sector (% of GDP)
2016,2015,2014,2013,2012,2011,2010,2009,2008,2007,2006,2005,2004,2003,2002,2001,2000,1999,1998,1997,1996,1995,1994,1993,1992,1991,1990,1989,1988,1987,1986,1985,1984,1983,1982,1981,1980,1979,1978,1977,1976,1975,1974,1973,1972,1971,1970
This statistics in other country:
AfghanistanAlbaniaAlgeriaAngolaAntigua and BarbudaArab WorldArgentinaArmeniaArubaAustraliaAustriaAzerbaijanBahamas, TheBahrainBangladeshBarbadosBelarusBelgiumBelizeBeninBhutanBoliviaBosnia and HerzegovinaBotswanaBrazilBrunei DarussalamBulgariaBurkina FasoBurundiCabo VerdeCambodiaCameroonCanadaCaribbean small statesCentral African RepublicCentral Europe and the BalticsChadChileChinaColombiaComorosCongo, Dem. Rep.Congo, Rep.Costa RicaCote d'IvoireCroatiaCyprusCzech RepublicDenmarkDjiboutiDominicaDominican RepublicEarly-demographic dividendEast Asia & PacificEast Asia & Pacific (excluding high income)East Asia & Pacific (IDA & IBRD countries)EcuadorEgypt, Arab Rep.El SalvadorEquatorial GuineaEritreaEstoniaEthiopiaEuro areaEurope & Central AsiaEurope & Central Asia (excluding high income)Europe & Central Asia (IDA & IBRD countries)European UnionFijiFinlandFragile and conflict affected situationsFranceGabonGambia, TheGeorgiaGermanyGhanaGreeceGrenadaGuatemalaGuineaGuinea-BissauGuyanaHaitiHeavily indebted poor countries (HIPC)High incomeHondurasHong Kong SAR, ChinaHungaryIBRD onlyIcelandIDA & IBRD totalIDA blendIDA onlyIDA totalIndiaIndonesiaIran, Islamic Rep.IraqIrelandIsraelItalyJamaicaJapanJordanKazakhstanKenyaKorea, Rep.KosovoKuwaitKyrgyz RepublicLao PDRLate-demographic dividendLatin America & Caribbean Latin America & Caribbean (excluding high income)Latin America & the Caribbean (IDA & IBRD countries)LatviaLeast developed countries: UN classificationLebanonLesothoLiberiaLibyaLithuaniaLow & middle incomeLow incomeLower middle incomeLuxembourgMacao SAR, ChinaMacedonia, FYRMadagascarMalawiMalaysiaMaldivesMaliMaltaMauritaniaMauritiusMexicoMicronesia, Fed. Sts.Middle East & North AfricaMiddle East & North Africa (excluding high income)Middle East & North Africa (IDA & IBRD countries)Middle incomeMoldovaMongoliaMontenegroMoroccoMozambiqueMyanmarNamibiaNepalNetherlandsNew ZealandNicaraguaNigerNigeriaNorth AmericaNorwayOECD membersOmanOther small statesPacific island small statesPakistanPanamaPapua New GuineaParaguayPeruPhilippinesPolandPortugalPost-demographic dividendPre-demographic dividendQatarRomaniaRussian FederationRwandaSamoaSao Tome and PrincipeSaudi ArabiaSenegalSerbiaSeychellesSierra LeoneSingaporeSlovak RepublicSloveniaSmall statesSolomon IslandsSouth AfricaSouth AsiaSouth Asia (IDA & IBRD)South SudanSpainSri LankaSt. Kitts and NevisSt. LuciaSt. Vincent and the GrenadinesSub-Saharan Africa Sub-Saharan Africa (excluding high income)Sub-Saharan Africa (IDA & IBRD countries)SudanSurinameSwazilandSwedenSwitzerlandSyrian Arab RepublicTajikistanTanzaniaThailandTimor-LesteTogoTongaTrinidad and TobagoTunisiaTurkeyUgandaUkraineUnited Arab EmiratesUnited KingdomUnited StatesUpper middle incomeUruguayVanuatuVenezuela, RBVietnamWest Bank and GazaWorldYemen, Rep.ZambiaZimbabwe Timeline:
This timeline shows a graph from 1970 to 2016 of Bahamas, The. No data until 1969. Number of actual observations by date: 47.
Source name:
World Development Indicators
Source organization:
International Monetary Fund, International Financial Statistics and data files, and World Bank and OECD GDP estimates.
Categories, topics:
Financial Sector, Private Sector
Last updated:
apr 23, 2017
Indicators value changes by year
Minimum:
36.098
jan 1, 1985
Maximum:
84.343
jan 1, 2010
At the date of observation
Value
Absolute change
Change from previous value
jan 1, 1970
59.959
+59.959
0.0%
jan 1, 1971
64.708
+4.749
7.92%
jan 1, 1972
38.507
-26.201
-40.49%
jan 1, 1973
40.904
+2.397
6.22%
jan 1, 1974
62.752
+21.848
53.41%
jan 1, 1975
51.344
-11.407
-18.18%
jan 1, 1976
60.248
+8.904
17.34%
jan 1, 1977
51.394
-8.854
-14.7%
jan 1, 1978
49.537
-1.857
-3.61%
jan 1, 1979
46.192
-3.345
-6.75%
jan 1, 1980
38.744
-7.448
-16.12%
jan 1, 1981
38.643
-0.101
-0.26%
jan 1, 1982
39.902
+1.259
3.26%
jan 1, 1983
39.644
-0.258
-0.65%
jan 1, 1984
39.058
-0.586
-1.48%
jan 1, 1985
36.098
-2.96
-7.58%
jan 1, 1986
36.209
+0.111
0.31%
jan 1, 1987
39.664
+3.455
9.54%
jan 1, 1988
42.745
+3.081
7.77%
jan 1, 1989
44.029
+1.284
3.0%
jan 1, 1990
43.491
-0.538
-1.22%
jan 1, 1991
46.311
+2.82
6.48%
jan 1, 1992
48.705
+2.395
5.17%
jan 1, 1993
50.814
+2.108
4.33%
jan 1, 1994
53.949
+3.135
6.17%
jan 1, 1995
57.027
+3.078
5.71%
jan 1, 1996
60.079
+3.052
5.35%
jan 1, 1997
62.35
+2.271
3.78%
jan 1, 1998
51.419
-10.931
-17.53%
jan 1, 1999
52.989
+1.57
3.05%
jan 1, 2000
52.47
-0.519
-0.98%
jan 1, 2001
57.191
+4.721
9.0%
jan 1, 2002
59.88
+2.689
4.7%
jan 1, 2003
58.49
-1.391
-2.32%
jan 1, 2004
58.919
+0.43
0.74%
jan 1, 2005
61.166
+2.247
3.81%
jan 1, 2006
64.284
+3.118
5.1%
jan 1, 2007
72.257
+7.973
12.4%
jan 1, 2008
74.749
+2.492
3.45%
jan 1, 2009
79.266
+4.517
6.04%
jan 1, 2010
84.343
+5.077
6.41%
jan 1, 2011
83.155
-1.188
-1.41%
jan 1, 2012
84.26
+1.105
1.33%
jan 1, 2013
78.934
-5.326
-6.32%
jan 1, 2014
76.446
-2.488
-3.15%
jan 1, 2015
75.057
-1.389
-1.82%
jan 1, 2016
72.312
-2.744
-3.66%
Ranking of countries by current statistics by years


Comments: