29
/
en
AIzaSyAYiBZKx7MnpbEhh9jyipgxe19OcubqV5w
April 1, 2024
239178
Sierra Leone
SLE
true
2
1
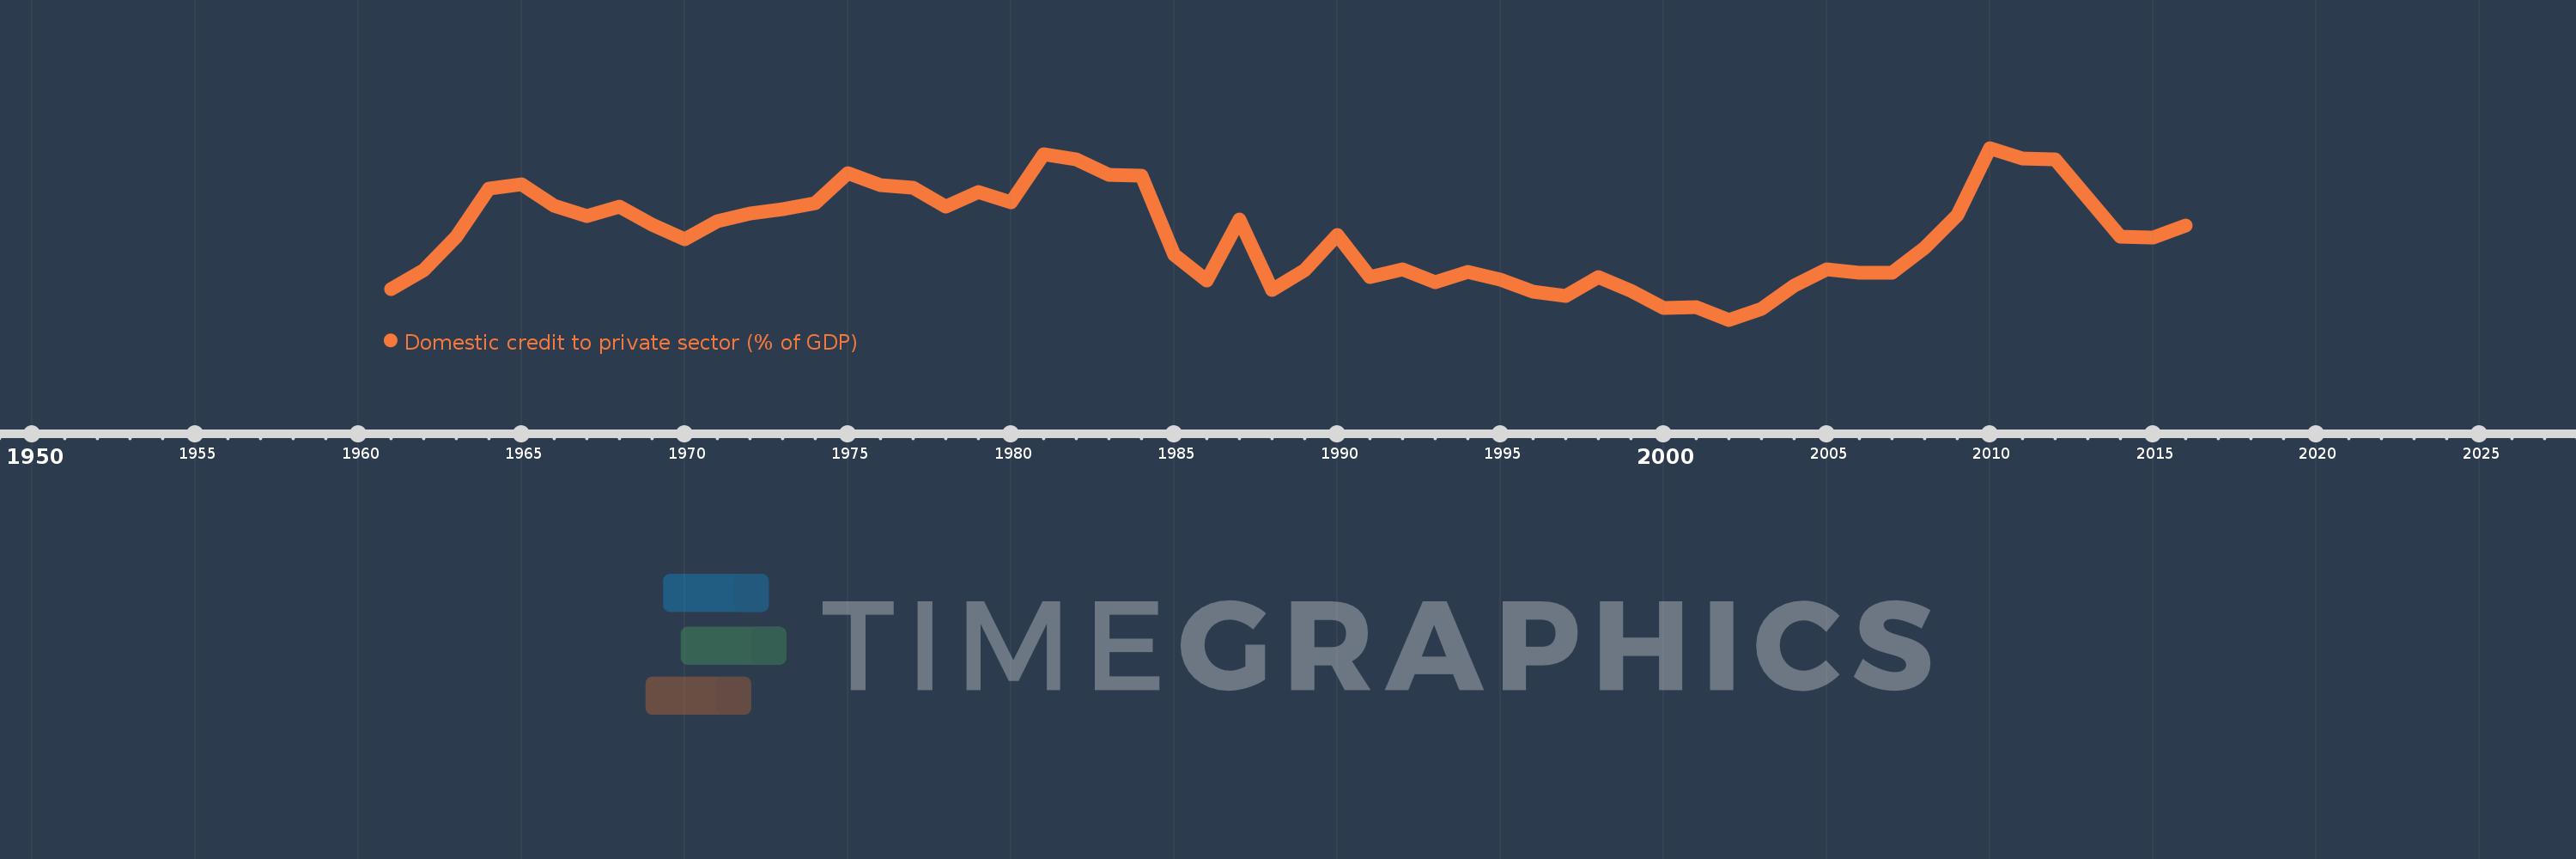
Domestic credit to private sector (% of GDP)
2016,2015,2014,2013,2012,2011,2010,2009,2008,2007,2006,2005,2004,2003,2002,2001,2000,1999,1998,1997,1996,1995,1994,1993,1992,1991,1990,1989,1988,1987,1986,1985,1984,1983,1982,1981,1980,1979,1978,1977,1976,1975,1974,1973,1972,1971,1970,1969,1968,1967,1966,1965,1964,1963,1962,1961
This statistics in other country:
AfghanistanAlbaniaAlgeriaAngolaAntigua and BarbudaArab WorldArgentinaArmeniaArubaAustraliaAustriaAzerbaijanBahamas, TheBahrainBangladeshBarbadosBelarusBelgiumBelizeBeninBhutanBoliviaBosnia and HerzegovinaBotswanaBrazilBrunei DarussalamBulgariaBurkina FasoBurundiCabo VerdeCambodiaCameroonCanadaCaribbean small statesCentral African RepublicCentral Europe and the BalticsChadChileChinaColombiaComorosCongo, Dem. Rep.Congo, Rep.Costa RicaCote d'IvoireCroatiaCyprusCzech RepublicDenmarkDjiboutiDominicaDominican RepublicEarly-demographic dividendEast Asia & PacificEast Asia & Pacific (excluding high income)East Asia & Pacific (IDA & IBRD countries)EcuadorEgypt, Arab Rep.El SalvadorEquatorial GuineaEritreaEstoniaEthiopiaEuro areaEurope & Central AsiaEurope & Central Asia (excluding high income)Europe & Central Asia (IDA & IBRD countries)European UnionFijiFinlandFragile and conflict affected situationsFranceGabonGambia, TheGeorgiaGermanyGhanaGreeceGrenadaGuatemalaGuineaGuinea-BissauGuyanaHaitiHeavily indebted poor countries (HIPC)High incomeHondurasHong Kong SAR, ChinaHungaryIBRD onlyIcelandIDA & IBRD totalIDA blendIDA onlyIDA totalIndiaIndonesiaIran, Islamic Rep.IraqIrelandIsraelItalyJamaicaJapanJordanKazakhstanKenyaKorea, Rep.KosovoKuwaitKyrgyz RepublicLao PDRLate-demographic dividendLatin America & Caribbean Latin America & Caribbean (excluding high income)Latin America & the Caribbean (IDA & IBRD countries)LatviaLeast developed countries: UN classificationLebanonLesothoLiberiaLibyaLithuaniaLow & middle incomeLow incomeLower middle incomeLuxembourgMacao SAR, ChinaMacedonia, FYRMadagascarMalawiMalaysiaMaldivesMaliMaltaMauritaniaMauritiusMexicoMicronesia, Fed. Sts.Middle East & North AfricaMiddle East & North Africa (excluding high income)Middle East & North Africa (IDA & IBRD countries)Middle incomeMoldovaMongoliaMontenegroMoroccoMozambiqueMyanmarNamibiaNepalNetherlandsNew ZealandNicaraguaNigerNigeriaNorth AmericaNorwayOECD membersOmanOther small statesPacific island small statesPakistanPanamaPapua New GuineaParaguayPeruPhilippinesPolandPortugalPost-demographic dividendPre-demographic dividendQatarRomaniaRussian FederationRwandaSamoaSao Tome and PrincipeSaudi ArabiaSenegalSerbiaSeychellesSierra LeoneSingaporeSlovak RepublicSloveniaSmall statesSolomon IslandsSouth AfricaSouth AsiaSouth Asia (IDA & IBRD)South SudanSpainSri LankaSt. Kitts and NevisSt. LuciaSt. Vincent and the GrenadinesSub-Saharan Africa Sub-Saharan Africa (excluding high income)Sub-Saharan Africa (IDA & IBRD countries)SudanSurinameSwazilandSwedenSwitzerlandSyrian Arab RepublicTajikistanTanzaniaThailandTimor-LesteTogoTongaTrinidad and TobagoTunisiaTurkeyUgandaUkraineUnited Arab EmiratesUnited KingdomUnited StatesUpper middle incomeUruguayVanuatuVenezuela, RBVietnamWest Bank and GazaWorldYemen, Rep.ZambiaZimbabwe Timeline:
This timeline shows a graph from 1961 to 2016 of Sierra Leone. No data until 1960. Number of actual observations by date: 56.
Source name:
World Development Indicators
Source organization:
International Monetary Fund, International Financial Statistics and data files, and World Bank and OECD GDP estimates.
Categories, topics:
Financial Sector, Private Sector
Last updated:
apr 23, 2017
Indicators value changes by year
At the date of observation
Value
Absolute change
Change from previous value
jan 1, 1961
2.769
+2.769
0.0%
jan 1, 1962
3.497
+0.728
26.29%
jan 1, 1963
4.756
+1.259
35.99%
jan 1, 1964
6.56
+1.804
37.94%
jan 1, 1965
6.738
+0.177
2.71%
jan 1, 1966
5.921
-0.816
-12.12%
jan 1, 1967
5.544
-0.377
-6.37%
jan 1, 1968
5.899
+0.354
6.39%
jan 1, 1969
5.217
-0.682
-11.56%
jan 1, 1970
4.674
-0.542
-10.4%
jan 1, 1971
5.329
+0.654
13.99%
jan 1, 1972
5.622
+0.294
5.51%
jan 1, 1973
5.809
+0.187
3.33%
jan 1, 1974
6.005
+0.196
3.37%
jan 1, 1975
7.162
+1.157
19.27%
jan 1, 1976
6.699
-0.464
-6.47%
jan 1, 1977
6.604
-0.095
-1.42%
jan 1, 1978
5.899
-0.705
-10.67%
jan 1, 1979
6.453
+0.553
9.38%
jan 1, 1980
6.055
-0.398
-6.16%
jan 1, 1981
7.868
+1.813
29.93%
jan 1, 1982
7.681
-0.187
-2.38%
jan 1, 1983
7.088
-0.593
-7.71%
jan 1, 1984
7.051
-0.037
-0.52%
jan 1, 1985
4.077
-2.974
-42.18%
jan 1, 1986
3.098
-0.979
-24.02%
jan 1, 1987
5.415
+2.317
74.79%
jan 1, 1988
2.744
-2.671
-49.33%
jan 1, 1989
3.496
+0.753
27.43%
jan 1, 1990
4.828
+1.331
38.08%
jan 1, 1991
3.247
-1.58
-32.73%
jan 1, 1992
3.523
+0.275
8.47%
jan 1, 1993
3.053
-0.469
-13.32%
jan 1, 1994
3.432
+0.378
12.39%
jan 1, 1995
3.128
-0.304
-8.85%
jan 1, 1996
2.676
-0.452
-14.44%
jan 1, 1997
2.507
-0.17
-6.34%
jan 1, 1998
3.245
+0.739
29.46%
jan 1, 1999
2.725
-0.521
-16.05%
jan 1, 2000
2.072
-0.653
-23.96%
jan 1, 2001
2.108
+0.036
1.75%
jan 1, 2002
1.62
-0.488
-23.14%
jan 1, 2003
2.024
+0.404
24.91%
jan 1, 2004
2.893
+0.869
42.93%
jan 1, 2005
3.516
+0.623
21.53%
jan 1, 2006
3.392
-0.123
-3.51%
jan 1, 2007
3.384
-0.008
-0.25%
jan 1, 2008
4.327
+0.943
27.88%
jan 1, 2009
5.575
+1.248
28.84%
jan 1, 2010
8.105
+2.53
45.39%
jan 1, 2011
7.708
-0.397
-4.9%
jan 1, 2012
7.667
-0.042
-0.54%
jan 1, 2013
6.219
-1.448
-18.88%
jan 1, 2014
4.769
-1.45
-23.31%
jan 1, 2015
4.712
-0.057
-1.2%
jan 1, 2016
5.163
+0.45
9.56%
Ranking of countries by current statistics by years


Comments: