29
/
en
AIzaSyAYiBZKx7MnpbEhh9jyipgxe19OcubqV5w
April 1, 2024
108423
Comoros
COM
true
2
1
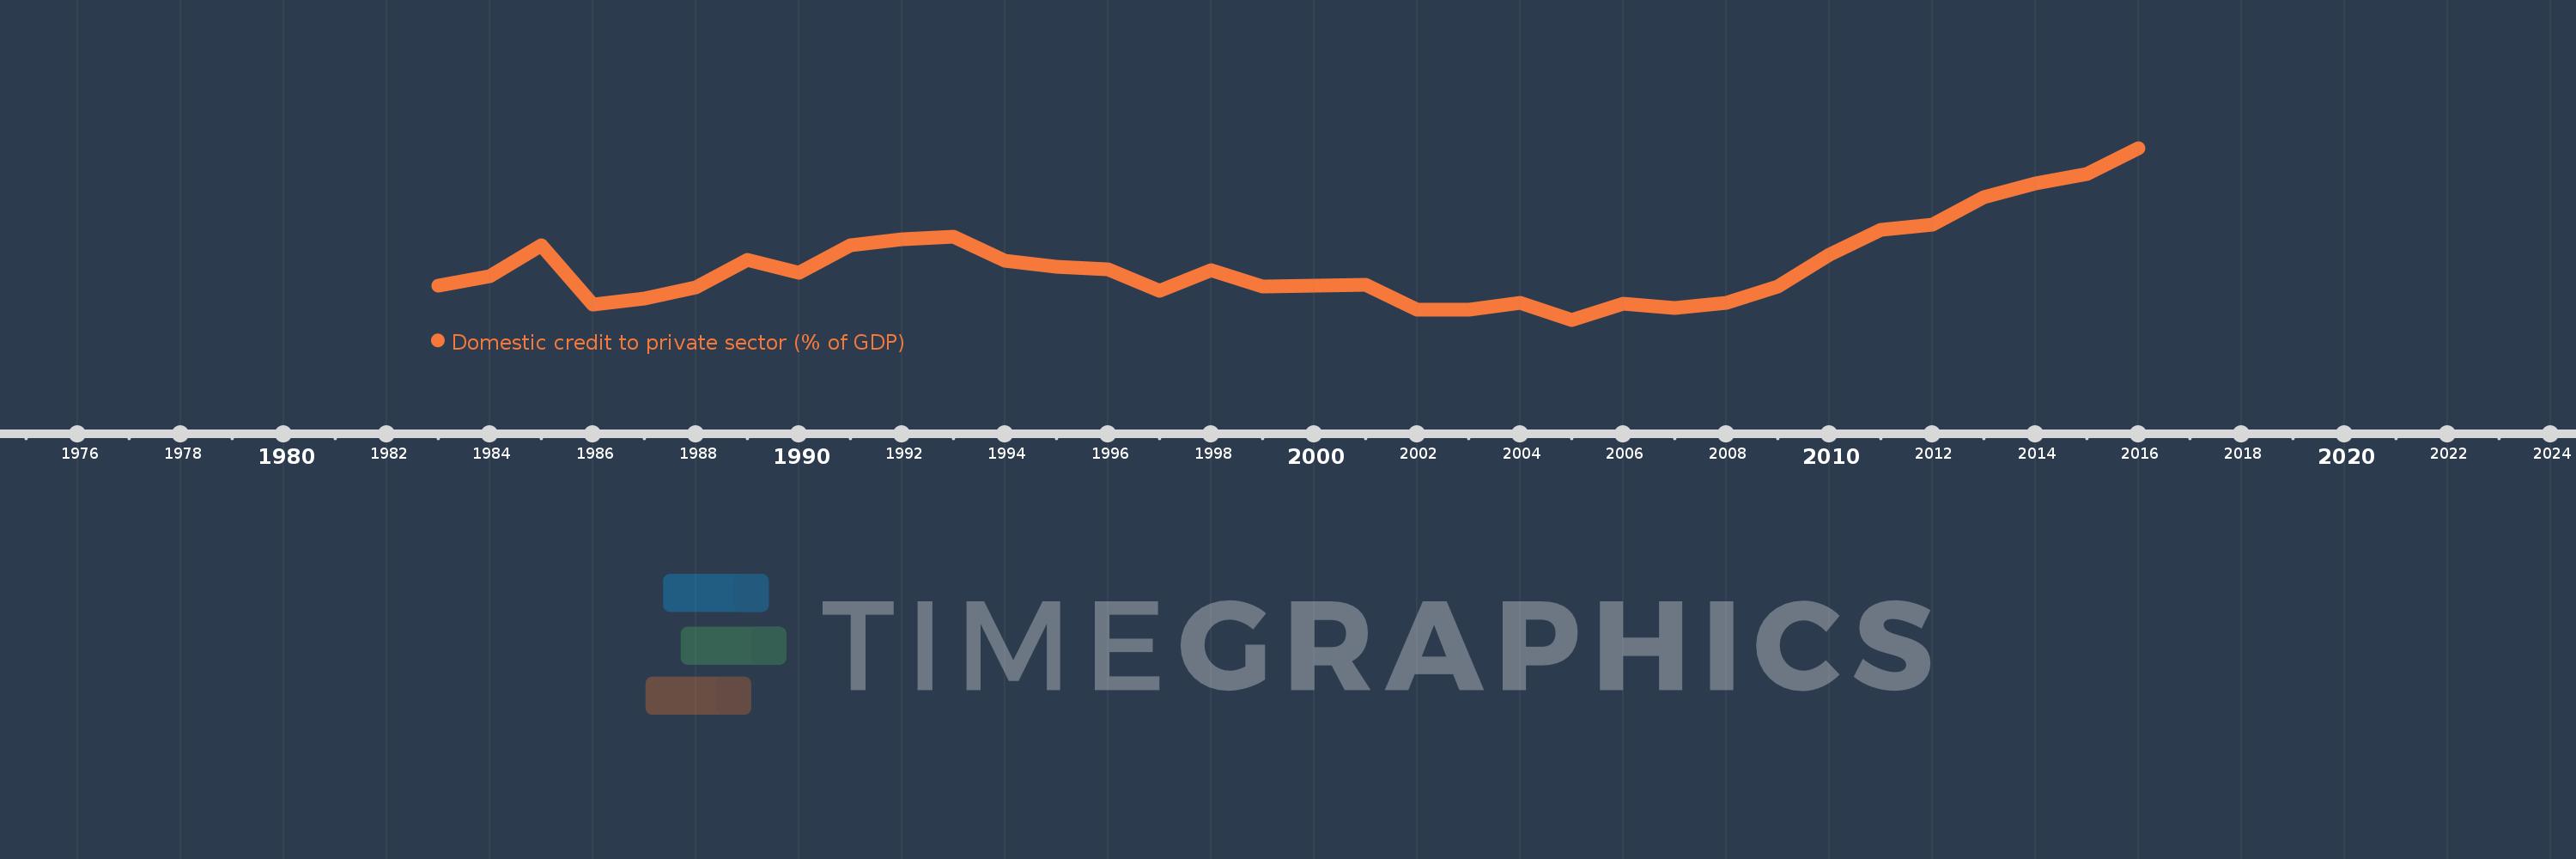
Domestic credit to private sector (% of GDP)
2016,2015,2014,2013,2012,2011,2010,2009,2008,2007,2006,2005,2004,2003,2002,2001,2000,1999,1998,1997,1996,1995,1994,1993,1992,1991,1990,1989,1988,1987,1986,1985,1984,1983
This statistics in other country:
AfghanistanAlbaniaAlgeriaAngolaAntigua and BarbudaArab WorldArgentinaArmeniaArubaAustraliaAustriaAzerbaijanBahamas, TheBahrainBangladeshBarbadosBelarusBelgiumBelizeBeninBhutanBoliviaBosnia and HerzegovinaBotswanaBrazilBrunei DarussalamBulgariaBurkina FasoBurundiCabo VerdeCambodiaCameroonCanadaCaribbean small statesCentral African RepublicCentral Europe and the BalticsChadChileChinaColombiaComorosCongo, Dem. Rep.Congo, Rep.Costa RicaCote d'IvoireCroatiaCyprusCzech RepublicDenmarkDjiboutiDominicaDominican RepublicEarly-demographic dividendEast Asia & PacificEast Asia & Pacific (excluding high income)East Asia & Pacific (IDA & IBRD countries)EcuadorEgypt, Arab Rep.El SalvadorEquatorial GuineaEritreaEstoniaEthiopiaEuro areaEurope & Central AsiaEurope & Central Asia (excluding high income)Europe & Central Asia (IDA & IBRD countries)European UnionFijiFinlandFragile and conflict affected situationsFranceGabonGambia, TheGeorgiaGermanyGhanaGreeceGrenadaGuatemalaGuineaGuinea-BissauGuyanaHaitiHeavily indebted poor countries (HIPC)High incomeHondurasHong Kong SAR, ChinaHungaryIBRD onlyIcelandIDA & IBRD totalIDA blendIDA onlyIDA totalIndiaIndonesiaIran, Islamic Rep.IraqIrelandIsraelItalyJamaicaJapanJordanKazakhstanKenyaKorea, Rep.KosovoKuwaitKyrgyz RepublicLao PDRLate-demographic dividendLatin America & Caribbean Latin America & Caribbean (excluding high income)Latin America & the Caribbean (IDA & IBRD countries)LatviaLeast developed countries: UN classificationLebanonLesothoLiberiaLibyaLithuaniaLow & middle incomeLow incomeLower middle incomeLuxembourgMacao SAR, ChinaMacedonia, FYRMadagascarMalawiMalaysiaMaldivesMaliMaltaMauritaniaMauritiusMexicoMicronesia, Fed. Sts.Middle East & North AfricaMiddle East & North Africa (excluding high income)Middle East & North Africa (IDA & IBRD countries)Middle incomeMoldovaMongoliaMontenegroMoroccoMozambiqueMyanmarNamibiaNepalNetherlandsNew ZealandNicaraguaNigerNigeriaNorth AmericaNorwayOECD membersOmanOther small statesPacific island small statesPakistanPanamaPapua New GuineaParaguayPeruPhilippinesPolandPortugalPost-demographic dividendPre-demographic dividendQatarRomaniaRussian FederationRwandaSamoaSao Tome and PrincipeSaudi ArabiaSenegalSerbiaSeychellesSierra LeoneSingaporeSlovak RepublicSloveniaSmall statesSolomon IslandsSouth AfricaSouth AsiaSouth Asia (IDA & IBRD)South SudanSpainSri LankaSt. Kitts and NevisSt. LuciaSt. Vincent and the GrenadinesSub-Saharan Africa Sub-Saharan Africa (excluding high income)Sub-Saharan Africa (IDA & IBRD countries)SudanSurinameSwazilandSwedenSwitzerlandSyrian Arab RepublicTajikistanTanzaniaThailandTimor-LesteTogoTongaTrinidad and TobagoTunisiaTurkeyUgandaUkraineUnited Arab EmiratesUnited KingdomUnited StatesUpper middle incomeUruguayVanuatuVenezuela, RBVietnamWest Bank and GazaWorldYemen, Rep.ZambiaZimbabwe Timeline:
This timeline shows a graph from 1983 to 2016 of Comoros. No data until 1982. Number of actual observations by date: 34.
Source name:
World Development Indicators
Source organization:
International Monetary Fund, International Financial Statistics and data files, and World Bank and OECD GDP estimates.
Categories, topics:
Financial Sector, Private Sector
Last updated:
apr 23, 2017
Indicators value changes by year
Maximum:
27.008
jan 1, 2016
At the date of observation
Value
Absolute change
Change from previous value
jan 1, 1983
11.714
+11.714
0.0%
jan 1, 1984
12.764
+1.05
8.96%
jan 1, 1985
16.137
+3.373
26.43%
jan 1, 1986
9.577
-6.56
-40.65%
jan 1, 1987
10.22
+0.643
6.72%
jan 1, 1988
11.527
+1.307
12.79%
jan 1, 1989
14.52
+2.993
25.97%
jan 1, 1990
13.147
-1.373
-9.46%
jan 1, 1991
16.175
+3.028
23.03%
jan 1, 1992
16.881
+0.706
4.36%
jan 1, 1993
17.142
+0.261
1.55%
jan 1, 1994
14.491
-2.651
-15.46%
jan 1, 1995
13.781
-0.71
-4.9%
jan 1, 1996
13.506
-0.275
-2.0%
jan 1, 1997
11.105
-2.402
-17.78%
jan 1, 1998
13.442
+2.337
21.05%
jan 1, 1999
11.587
-1.854
-13.8%
jan 1, 2000
11.654
+0.067
0.57%
jan 1, 2001
11.831
+0.177
1.52%
jan 1, 2002
9.022
-2.809
-23.74%
jan 1, 2003
9.063
+0.041
0.45%
jan 1, 2004
9.76
+0.697
7.69%
jan 1, 2005
7.901
-1.859
-19.04%
jan 1, 2006
9.685
+1.784
22.58%
jan 1, 2007
9.221
-0.463
-4.79%
jan 1, 2008
9.786
+0.564
6.12%
jan 1, 2009
11.641
+1.856
18.96%
jan 1, 2010
15.11
+3.469
29.8%
jan 1, 2011
17.916
+2.806
18.57%
jan 1, 2012
18.522
+0.607
3.39%
jan 1, 2013
21.531
+3.008
16.24%
jan 1, 2014
23.097
+1.566
7.28%
jan 1, 2015
24.157
+1.06
4.59%
jan 1, 2016
27.008
+2.852
11.81%
Ranking of countries by current statistics by years


Comments: