29
/
en
AIzaSyAYiBZKx7MnpbEhh9jyipgxe19OcubqV5w
April 1, 2024
109537
Congo, Dem. Rep.
COD
true
2
1
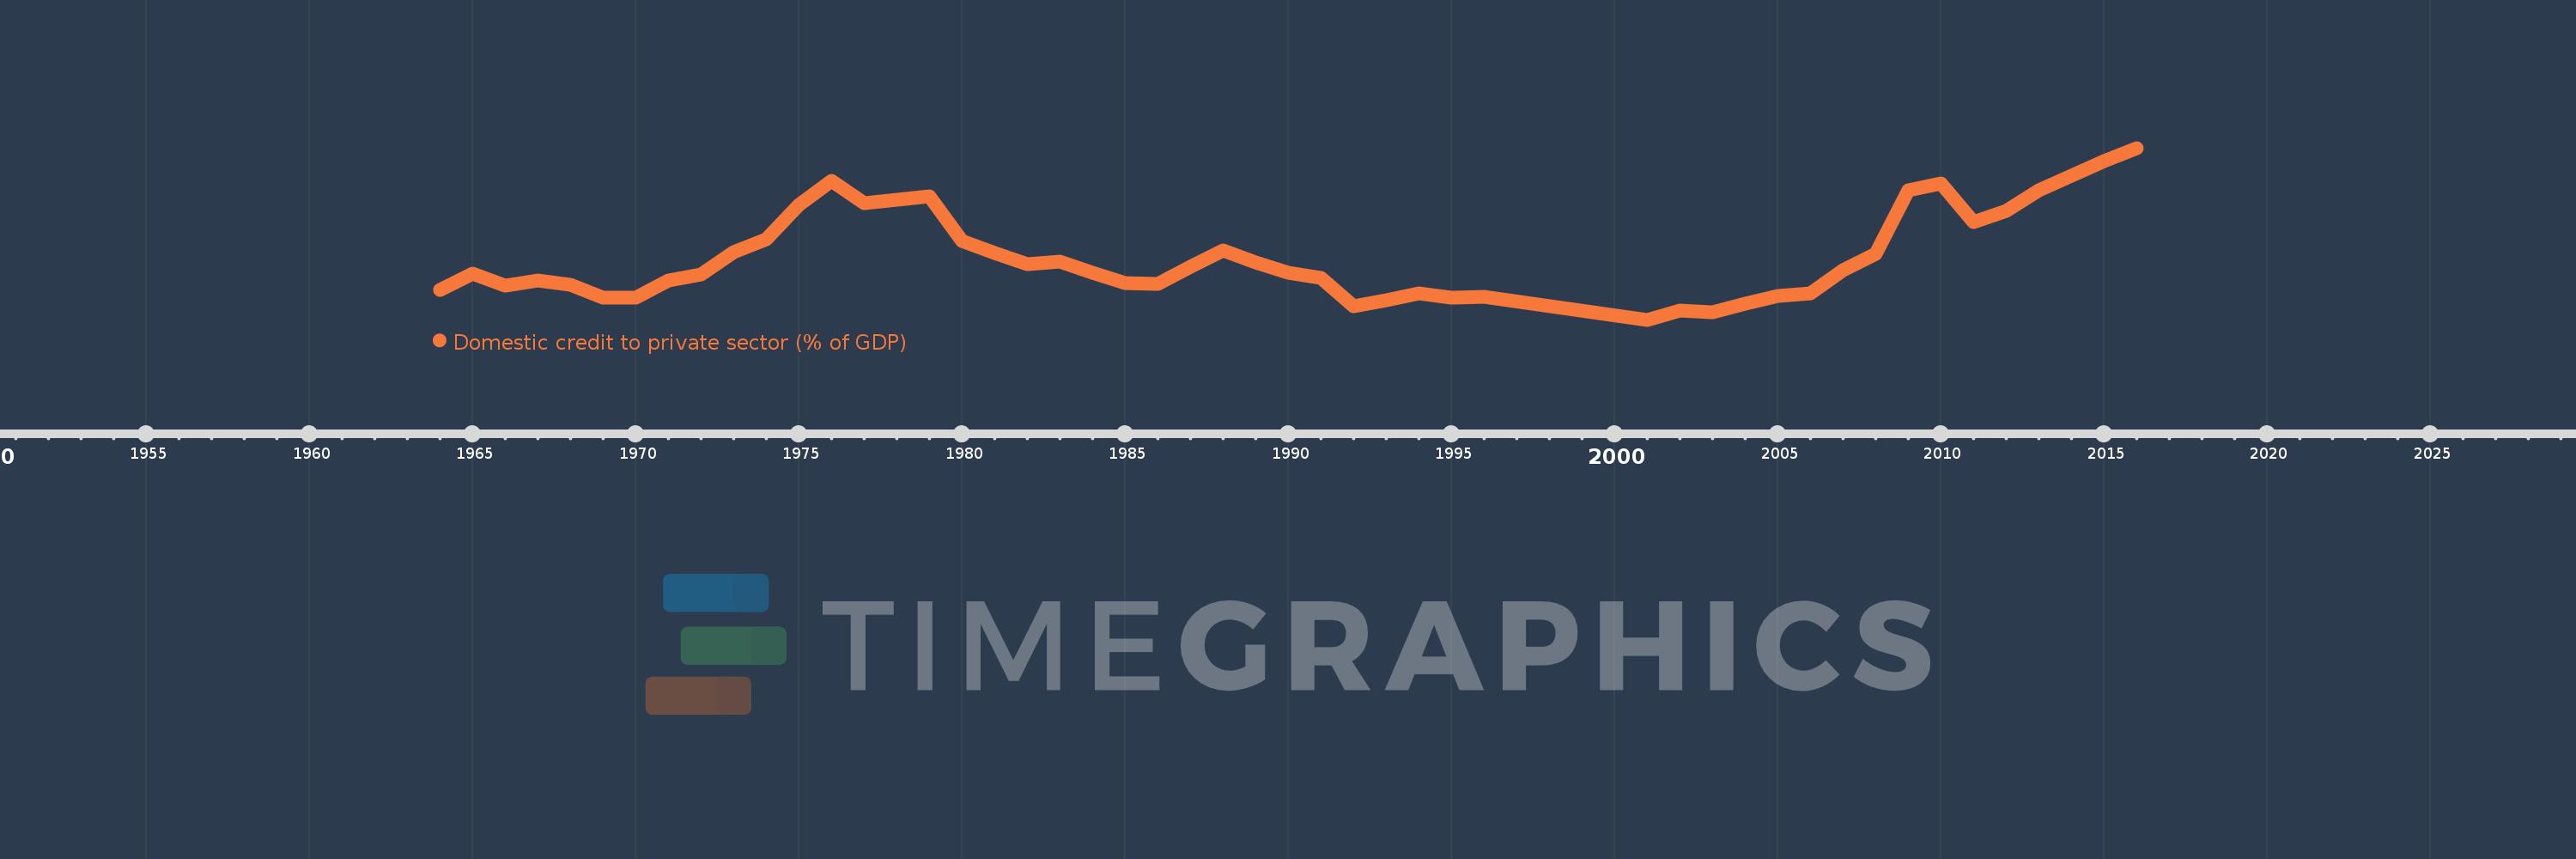
Domestic credit to private sector (% of GDP)
2016,2015,2014,2013,2012,2011,2010,2009,2008,2007,2006,2005,2004,2003,2002,2001,1996,1995,1994,1993,1992,1991,1990,1989,1988,1987,1986,1985,1984,1983,1982,1981,1980,1979,1978,1977,1976,1975,1974,1973,1972,1971,1970,1969,1968,1967,1966,1965,1964
This statistics in other country:
AfghanistanAlbaniaAlgeriaAngolaAntigua and BarbudaArab WorldArgentinaArmeniaArubaAustraliaAustriaAzerbaijanBahamas, TheBahrainBangladeshBarbadosBelarusBelgiumBelizeBeninBhutanBoliviaBosnia and HerzegovinaBotswanaBrazilBrunei DarussalamBulgariaBurkina FasoBurundiCabo VerdeCambodiaCameroonCanadaCaribbean small statesCentral African RepublicCentral Europe and the BalticsChadChileChinaColombiaComorosCongo, Dem. Rep.Congo, Rep.Costa RicaCote d'IvoireCroatiaCyprusCzech RepublicDenmarkDjiboutiDominicaDominican RepublicEarly-demographic dividendEast Asia & PacificEast Asia & Pacific (excluding high income)East Asia & Pacific (IDA & IBRD countries)EcuadorEgypt, Arab Rep.El SalvadorEquatorial GuineaEritreaEstoniaEthiopiaEuro areaEurope & Central AsiaEurope & Central Asia (excluding high income)Europe & Central Asia (IDA & IBRD countries)European UnionFijiFinlandFragile and conflict affected situationsFranceGabonGambia, TheGeorgiaGermanyGhanaGreeceGrenadaGuatemalaGuineaGuinea-BissauGuyanaHaitiHeavily indebted poor countries (HIPC)High incomeHondurasHong Kong SAR, ChinaHungaryIBRD onlyIcelandIDA & IBRD totalIDA blendIDA onlyIDA totalIndiaIndonesiaIran, Islamic Rep.IraqIrelandIsraelItalyJamaicaJapanJordanKazakhstanKenyaKorea, Rep.KosovoKuwaitKyrgyz RepublicLao PDRLate-demographic dividendLatin America & Caribbean Latin America & Caribbean (excluding high income)Latin America & the Caribbean (IDA & IBRD countries)LatviaLeast developed countries: UN classificationLebanonLesothoLiberiaLibyaLithuaniaLow & middle incomeLow incomeLower middle incomeLuxembourgMacao SAR, ChinaMacedonia, FYRMadagascarMalawiMalaysiaMaldivesMaliMaltaMauritaniaMauritiusMexicoMicronesia, Fed. Sts.Middle East & North AfricaMiddle East & North Africa (excluding high income)Middle East & North Africa (IDA & IBRD countries)Middle incomeMoldovaMongoliaMontenegroMoroccoMozambiqueMyanmarNamibiaNepalNetherlandsNew ZealandNicaraguaNigerNigeriaNorth AmericaNorwayOECD membersOmanOther small statesPacific island small statesPakistanPanamaPapua New GuineaParaguayPeruPhilippinesPolandPortugalPost-demographic dividendPre-demographic dividendQatarRomaniaRussian FederationRwandaSamoaSao Tome and PrincipeSaudi ArabiaSenegalSerbiaSeychellesSierra LeoneSingaporeSlovak RepublicSloveniaSmall statesSolomon IslandsSouth AfricaSouth AsiaSouth Asia (IDA & IBRD)South SudanSpainSri LankaSt. Kitts and NevisSt. LuciaSt. Vincent and the GrenadinesSub-Saharan Africa Sub-Saharan Africa (excluding high income)Sub-Saharan Africa (IDA & IBRD countries)SudanSurinameSwazilandSwedenSwitzerlandSyrian Arab RepublicTajikistanTanzaniaThailandTimor-LesteTogoTongaTrinidad and TobagoTunisiaTurkeyUgandaUkraineUnited Arab EmiratesUnited KingdomUnited StatesUpper middle incomeUruguayVanuatuVenezuela, RBVietnamWest Bank and GazaWorldYemen, Rep.ZambiaZimbabwe Timeline:
This timeline shows a graph from 1964 to 2016 of Congo, Dem. Rep.. No data until 1963. Number of actual observations by date: 49.
Source name:
World Development Indicators
Source organization:
International Monetary Fund, International Financial Statistics and data files, and World Bank and OECD GDP estimates.
Categories, topics:
Financial Sector, Private Sector
Last updated:
apr 23, 2017
Indicators value changes by year
At the date of observation
Value
Absolute change
Change from previous value
jan 1, 1964
1.339
+1.339
0.0%
jan 1, 1965
1.956
+0.617
46.13%
jan 1, 1966
1.499
-0.457
-23.38%
jan 1, 1967
1.698
+0.199
13.31%
jan 1, 1968
1.541
-0.157
-9.23%
jan 1, 1969
1.052
-0.49
-31.77%
jan 1, 1970
1.056
+0.004
0.38%
jan 1, 1971
1.684
+0.628
59.51%
jan 1, 1972
1.926
+0.242
14.36%
jan 1, 1973
2.774
+0.848
44.05%
jan 1, 1974
3.275
+0.501
18.05%
jan 1, 1975
4.582
+1.307
39.92%
jan 1, 1976
5.518
+0.936
20.43%
jan 1, 1977
4.66
-0.859
-15.56%
jan 1, 1978
4.796
+0.137
2.93%
jan 1, 1979
4.91
+0.114
2.37%
jan 1, 1980
3.206
-1.704
-34.71%
jan 1, 1981
2.742
-0.463
-14.46%
jan 1, 1982
2.315
-0.427
-15.56%
jan 1, 1983
2.422
+0.107
4.6%
jan 1, 1984
1.987
-0.435
-17.98%
jan 1, 1985
1.589
-0.397
-20.0%
jan 1, 1986
1.562
-0.027
-1.68%
jan 1, 1987
2.233
+0.671
42.93%
jan 1, 1988
2.833
+0.6
26.85%
jan 1, 1989
2.377
-0.455
-16.07%
jan 1, 1990
1.998
-0.38
-15.97%
jan 1, 1991
1.81
-0.188
-9.42%
jan 1, 1992
0.724
-1.086
-59.99%
jan 1, 1993
0.929
+0.204
28.24%
jan 1, 1994
1.211
+0.282
30.4%
jan 1, 1995
1.057
-0.154
-12.72%
jan 1, 1996
1.063
+0.006
0.59%
jan 1, 2001
0.198
-0.865
-81.35%
jan 1, 2002
0.544
+0.346
174.3%
jan 1, 2003
0.491
-0.053
-9.66%
jan 1, 2004
0.796
+0.305
61.99%
jan 1, 2005
1.095
+0.299
37.59%
jan 1, 2006
1.201
+0.106
9.66%
jan 1, 2007
2.106
+0.905
75.34%
jan 1, 2008
2.707
+0.601
28.55%
jan 1, 2009
5.14
+2.433
89.87%
jan 1, 2010
5.412
+0.272
5.29%
jan 1, 2011
3.922
-1.49
-27.53%
jan 1, 2012
4.359
+0.436
11.13%
jan 1, 2013
5.134
+0.775
17.79%
jan 1, 2014
5.711
+0.577
11.23%
jan 1, 2015
6.265
+0.554
9.7%
jan 1, 2016
6.76
+0.495
7.91%
Ranking of countries by current statistics by years


Comments: