29
/
en
AIzaSyAYiBZKx7MnpbEhh9jyipgxe19OcubqV5w
April 1, 2024
37268
IDA & IBRD total
IBT
false
2
1
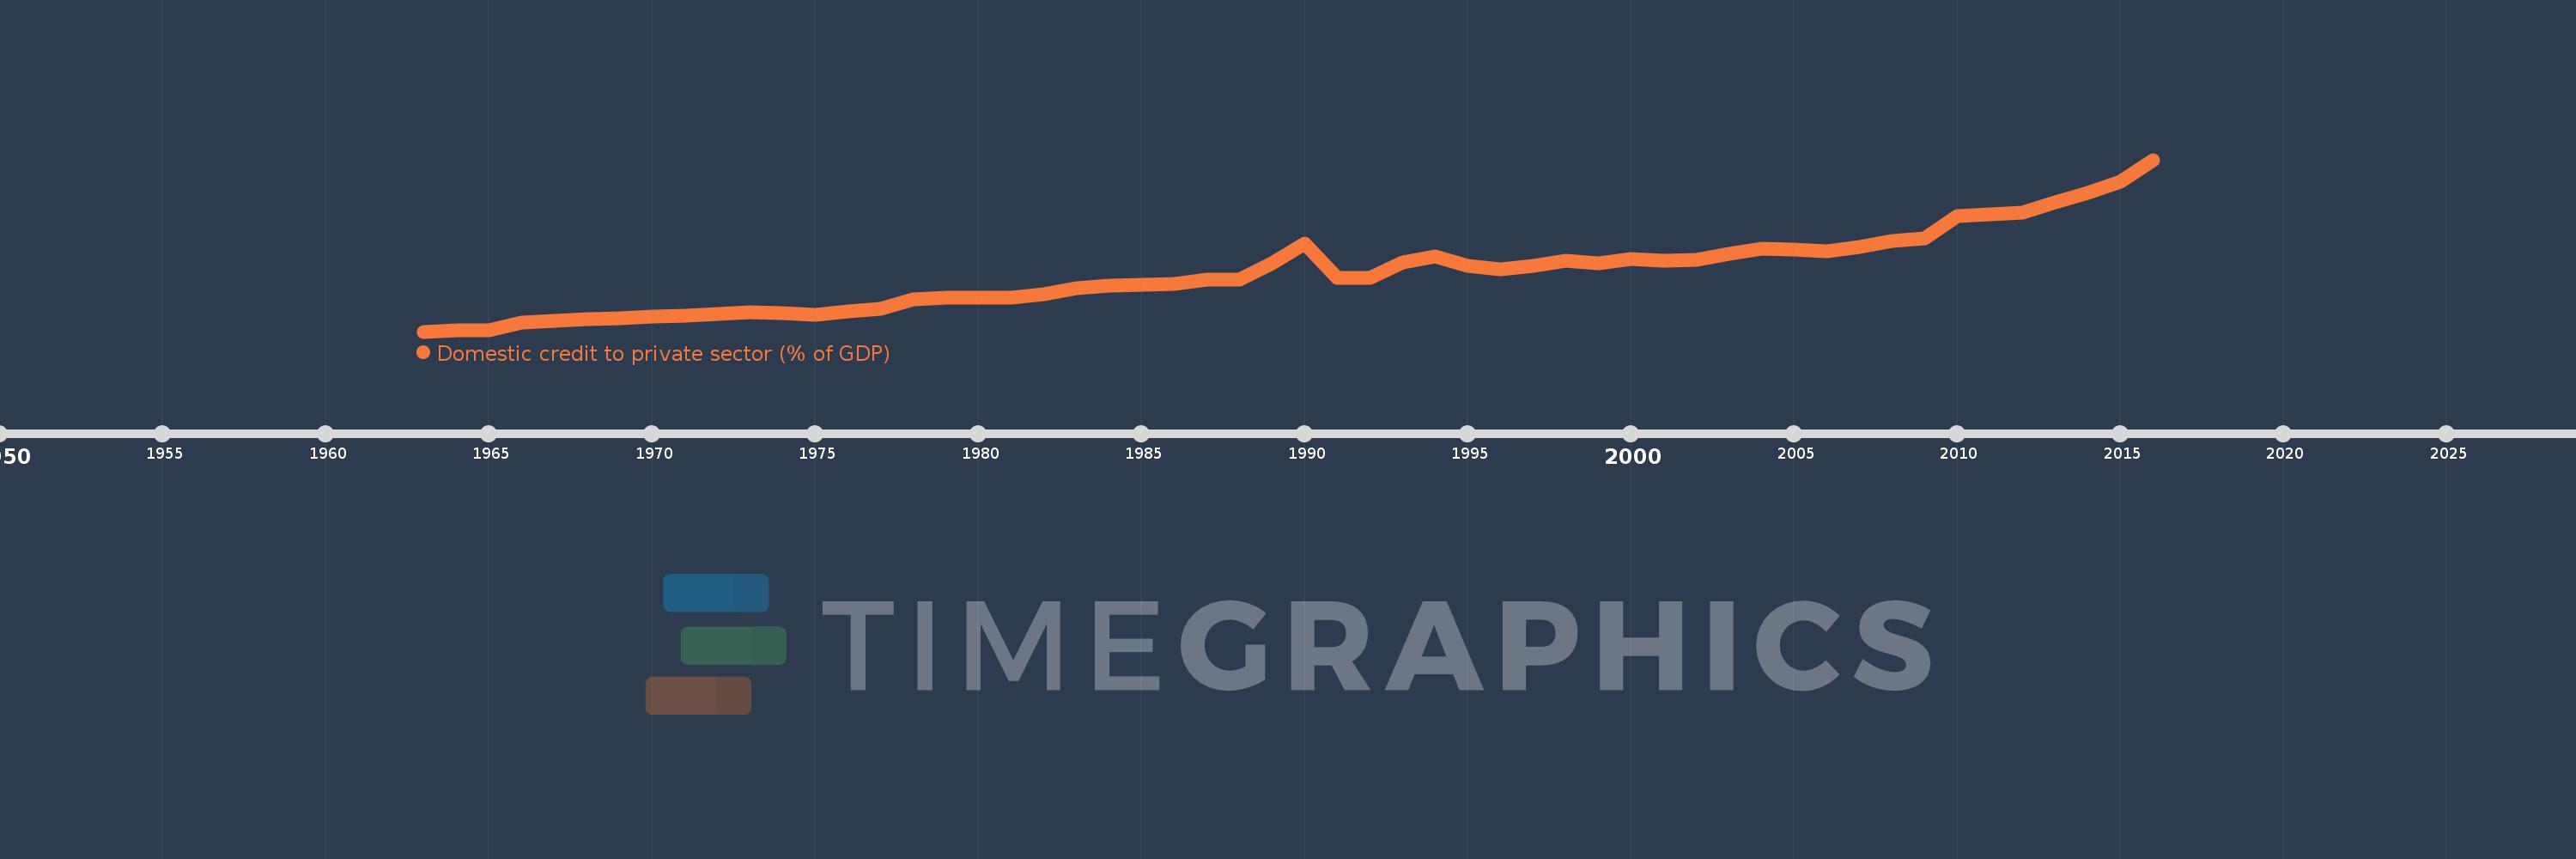
Domestic credit to private sector (% of GDP)
2016,2015,2014,2013,2012,2011,2010,2009,2008,2007,2006,2005,2004,2003,2002,2001,2000,1999,1998,1997,1996,1995,1994,1993,1992,1991,1990,1989,1988,1987,1986,1985,1984,1983,1982,1981,1980,1979,1978,1977,1976,1975,1974,1973,1972,1971,1970,1969,1968,1967,1966,1965,1964,1963
This statistics in other country:
AfghanistanAlbaniaAlgeriaAngolaAntigua and BarbudaArab WorldArgentinaArmeniaArubaAustraliaAustriaAzerbaijanBahamas, TheBahrainBangladeshBarbadosBelarusBelgiumBelizeBeninBhutanBoliviaBosnia and HerzegovinaBotswanaBrazilBrunei DarussalamBulgariaBurkina FasoBurundiCabo VerdeCambodiaCameroonCanadaCaribbean small statesCentral African RepublicCentral Europe and the BalticsChadChileChinaColombiaComorosCongo, Dem. Rep.Congo, Rep.Costa RicaCote d'IvoireCroatiaCyprusCzech RepublicDenmarkDjiboutiDominicaDominican RepublicEarly-demographic dividendEast Asia & PacificEast Asia & Pacific (excluding high income)East Asia & Pacific (IDA & IBRD countries)EcuadorEgypt, Arab Rep.El SalvadorEquatorial GuineaEritreaEstoniaEthiopiaEuro areaEurope & Central AsiaEurope & Central Asia (excluding high income)Europe & Central Asia (IDA & IBRD countries)European UnionFijiFinlandFragile and conflict affected situationsFranceGabonGambia, TheGeorgiaGermanyGhanaGreeceGrenadaGuatemalaGuineaGuinea-BissauGuyanaHaitiHeavily indebted poor countries (HIPC)High incomeHondurasHong Kong SAR, ChinaHungaryIBRD onlyIcelandIDA & IBRD totalIDA blendIDA onlyIDA totalIndiaIndonesiaIran, Islamic Rep.IraqIrelandIsraelItalyJamaicaJapanJordanKazakhstanKenyaKorea, Rep.KosovoKuwaitKyrgyz RepublicLao PDRLate-demographic dividendLatin America & Caribbean Latin America & Caribbean (excluding high income)Latin America & the Caribbean (IDA & IBRD countries)LatviaLeast developed countries: UN classificationLebanonLesothoLiberiaLibyaLithuaniaLow & middle incomeLow incomeLower middle incomeLuxembourgMacao SAR, ChinaMacedonia, FYRMadagascarMalawiMalaysiaMaldivesMaliMaltaMauritaniaMauritiusMexicoMicronesia, Fed. Sts.Middle East & North AfricaMiddle East & North Africa (excluding high income)Middle East & North Africa (IDA & IBRD countries)Middle incomeMoldovaMongoliaMontenegroMoroccoMozambiqueMyanmarNamibiaNepalNetherlandsNew ZealandNicaraguaNigerNigeriaNorth AmericaNorwayOECD membersOmanOther small statesPacific island small statesPakistanPanamaPapua New GuineaParaguayPeruPhilippinesPolandPortugalPost-demographic dividendPre-demographic dividendQatarRomaniaRussian FederationRwandaSamoaSao Tome and PrincipeSaudi ArabiaSenegalSerbiaSeychellesSierra LeoneSingaporeSlovak RepublicSloveniaSmall statesSolomon IslandsSouth AfricaSouth AsiaSouth Asia (IDA & IBRD)South SudanSpainSri LankaSt. Kitts and NevisSt. LuciaSt. Vincent and the GrenadinesSub-Saharan Africa Sub-Saharan Africa (excluding high income)Sub-Saharan Africa (IDA & IBRD countries)SudanSurinameSwazilandSwedenSwitzerlandSyrian Arab RepublicTajikistanTanzaniaThailandTimor-LesteTogoTongaTrinidad and TobagoTunisiaTurkeyUgandaUkraineUnited Arab EmiratesUnited KingdomUnited StatesUpper middle incomeUruguayVanuatuVenezuela, RBVietnamWest Bank and GazaWorldYemen, Rep.ZambiaZimbabwe Timeline:
This timeline shows a graph from 1963 to 2016 of IDA & IBRD total. No data until 1962. Number of actual observations by date: 54.
Source name:
World Development Indicators
Source organization:
International Monetary Fund, International Financial Statistics and data files, and World Bank and OECD GDP estimates.
Categories, topics:
Financial Sector, Private Sector
Last updated:
apr 23, 2017
Indicators value changes by year
Minimum:
13.067
jan 1, 1963
At the date of observation
Value
Absolute change
Change from previous value
jan 1, 1963
13.067
+13.067
0.0%
jan 1, 1964
13.785
+0.718
5.49%
jan 1, 1965
13.772
-0.012
-0.09%
jan 1, 1966
17.263
+3.491
25.35%
jan 1, 1967
18.183
+0.919
5.33%
jan 1, 1968
18.866
+0.683
3.76%
jan 1, 1969
19.439
+0.573
3.04%
jan 1, 1970
20.344
+0.905
4.66%
jan 1, 1971
20.807
+0.463
2.28%
jan 1, 1972
21.657
+0.85
4.08%
jan 1, 1973
22.162
+0.506
2.34%
jan 1, 1974
22.109
-0.053
-0.24%
jan 1, 1975
20.972
-1.137
-5.14%
jan 1, 1976
22.813
+1.84
8.78%
jan 1, 1977
24.044
+1.232
5.4%
jan 1, 1978
28.542
+4.498
18.71%
jan 1, 1979
29.45
+0.908
3.18%
jan 1, 1980
29.317
-0.133
-0.45%
jan 1, 1981
29.225
-0.092
-0.31%
jan 1, 1982
30.886
+1.661
5.68%
jan 1, 1983
33.87
+2.985
9.66%
jan 1, 1984
35.207
+1.336
3.95%
jan 1, 1985
35.536
+0.329
0.93%
jan 1, 1986
35.774
+0.238
0.67%
jan 1, 1987
38.134
+2.36
6.6%
jan 1, 1988
37.804
-0.329
-0.86%
jan 1, 1989
45.723
+7.919
20.95%
jan 1, 1990
55.136
+9.413
20.59%
jan 1, 1991
38.836
-16.3
-29.56%
jan 1, 1992
38.814
-0.022
-0.06%
jan 1, 1993
46.205
+7.391
19.04%
jan 1, 1994
49.033
+2.827
6.12%
jan 1, 1995
44.593
-4.44
-9.05%
jan 1, 1996
42.805
-1.788
-4.01%
jan 1, 1997
44.447
+1.642
3.84%
jan 1, 1998
47.095
+2.648
5.96%
jan 1, 1999
45.882
-1.213
-2.57%
jan 1, 2000
47.842
+1.96
4.27%
jan 1, 2001
47.103
-0.739
-1.55%
jan 1, 2002
47.512
+0.409
0.87%
jan 1, 2003
50.349
+2.837
5.97%
jan 1, 2004
52.779
+2.431
4.83%
jan 1, 2005
52.437
-0.342
-0.65%
jan 1, 2006
51.695
-0.742
-1.42%
jan 1, 2007
53.422
+1.727
3.34%
jan 1, 2008
56.396
+2.973
5.57%
jan 1, 2009
57.834
+1.438
2.55%
jan 1, 2010
68.386
+10.552
18.25%
jan 1, 2011
69.112
+0.726
1.06%
jan 1, 2012
70.151
+1.038
1.5%
jan 1, 2013
74.775
+4.624
6.59%
jan 1, 2014
79.336
+4.561
6.1%
jan 1, 2015
84.963
+5.628
7.09%
jan 1, 2016
95.3
+10.336
12.17%
Ranking of countries by current statistics by years


Comments: