29
/
en
AIzaSyAYiBZKx7MnpbEhh9jyipgxe19OcubqV5w
April 1, 2024
215138
Oman
OMN
true
2
1
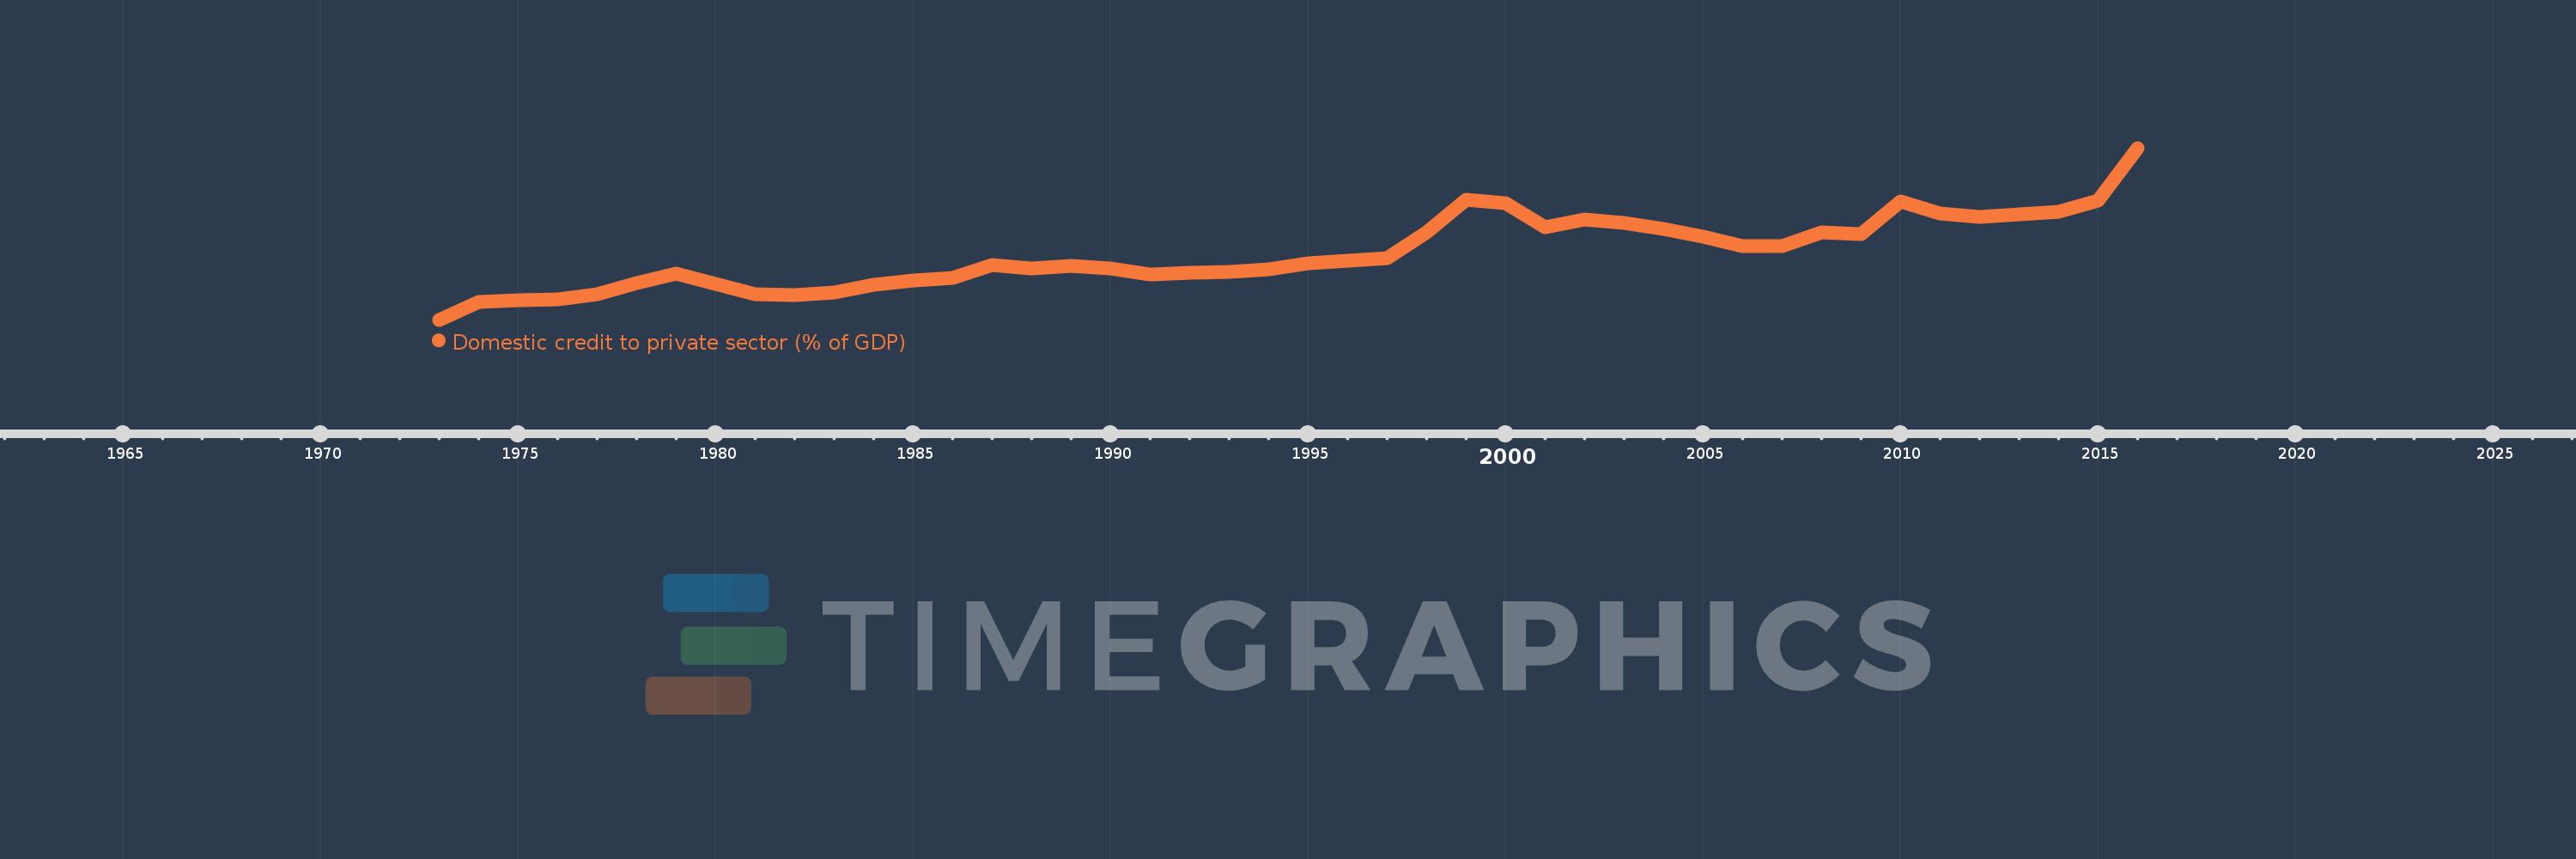
Domestic credit to private sector (% of GDP)
2016,2015,2014,2013,2012,2011,2010,2009,2008,2007,2006,2005,2004,2003,2002,2001,2000,1999,1998,1997,1996,1995,1994,1993,1992,1991,1990,1989,1988,1987,1986,1985,1984,1983,1982,1981,1980,1979,1978,1977,1976,1975,1974,1973
This statistics in other country:
AfghanistanAlbaniaAlgeriaAngolaAntigua and BarbudaArab WorldArgentinaArmeniaArubaAustraliaAustriaAzerbaijanBahamas, TheBahrainBangladeshBarbadosBelarusBelgiumBelizeBeninBhutanBoliviaBosnia and HerzegovinaBotswanaBrazilBrunei DarussalamBulgariaBurkina FasoBurundiCabo VerdeCambodiaCameroonCanadaCaribbean small statesCentral African RepublicCentral Europe and the BalticsChadChileChinaColombiaComorosCongo, Dem. Rep.Congo, Rep.Costa RicaCote d'IvoireCroatiaCyprusCzech RepublicDenmarkDjiboutiDominicaDominican RepublicEarly-demographic dividendEast Asia & PacificEast Asia & Pacific (excluding high income)East Asia & Pacific (IDA & IBRD countries)EcuadorEgypt, Arab Rep.El SalvadorEquatorial GuineaEritreaEstoniaEthiopiaEuro areaEurope & Central AsiaEurope & Central Asia (excluding high income)Europe & Central Asia (IDA & IBRD countries)European UnionFijiFinlandFragile and conflict affected situationsFranceGabonGambia, TheGeorgiaGermanyGhanaGreeceGrenadaGuatemalaGuineaGuinea-BissauGuyanaHaitiHeavily indebted poor countries (HIPC)High incomeHondurasHong Kong SAR, ChinaHungaryIBRD onlyIcelandIDA & IBRD totalIDA blendIDA onlyIDA totalIndiaIndonesiaIran, Islamic Rep.IraqIrelandIsraelItalyJamaicaJapanJordanKazakhstanKenyaKorea, Rep.KosovoKuwaitKyrgyz RepublicLao PDRLate-demographic dividendLatin America & Caribbean Latin America & Caribbean (excluding high income)Latin America & the Caribbean (IDA & IBRD countries)LatviaLeast developed countries: UN classificationLebanonLesothoLiberiaLibyaLithuaniaLow & middle incomeLow incomeLower middle incomeLuxembourgMacao SAR, ChinaMacedonia, FYRMadagascarMalawiMalaysiaMaldivesMaliMaltaMauritaniaMauritiusMexicoMicronesia, Fed. Sts.Middle East & North AfricaMiddle East & North Africa (excluding high income)Middle East & North Africa (IDA & IBRD countries)Middle incomeMoldovaMongoliaMontenegroMoroccoMozambiqueMyanmarNamibiaNepalNetherlandsNew ZealandNicaraguaNigerNigeriaNorth AmericaNorwayOECD membersOmanOther small statesPacific island small statesPakistanPanamaPapua New GuineaParaguayPeruPhilippinesPolandPortugalPost-demographic dividendPre-demographic dividendQatarRomaniaRussian FederationRwandaSamoaSao Tome and PrincipeSaudi ArabiaSenegalSerbiaSeychellesSierra LeoneSingaporeSlovak RepublicSloveniaSmall statesSolomon IslandsSouth AfricaSouth AsiaSouth Asia (IDA & IBRD)South SudanSpainSri LankaSt. Kitts and NevisSt. LuciaSt. Vincent and the GrenadinesSub-Saharan Africa Sub-Saharan Africa (excluding high income)Sub-Saharan Africa (IDA & IBRD countries)SudanSurinameSwazilandSwedenSwitzerlandSyrian Arab RepublicTajikistanTanzaniaThailandTimor-LesteTogoTongaTrinidad and TobagoTunisiaTurkeyUgandaUkraineUnited Arab EmiratesUnited KingdomUnited StatesUpper middle incomeUruguayVanuatuVenezuela, RBVietnamWest Bank and GazaWorldYemen, Rep.ZambiaZimbabwe Timeline:
This timeline shows a graph from 1973 to 2016 of Oman. No data until 1972. Number of actual observations by date: 44.
Source name:
World Development Indicators
Source organization:
International Monetary Fund, International Financial Statistics and data files, and World Bank and OECD GDP estimates.
Categories, topics:
Financial Sector, Private Sector
Last updated:
apr 23, 2017
Indicators value changes by year
Maximum:
65.569
jan 1, 2016
At the date of observation
Value
Absolute change
Change from previous value
jan 1, 1973
4.704
+4.704
0.0%
jan 1, 1974
11.135
+6.431
136.71%
jan 1, 1975
11.581
+0.446
4.01%
jan 1, 1976
11.868
+0.288
2.48%
jan 1, 1977
13.593
+1.725
14.53%
jan 1, 1978
17.649
+4.056
29.84%
jan 1, 1979
20.959
+3.31
18.75%
jan 1, 1980
17.261
-3.698
-17.64%
jan 1, 1981
13.706
-3.555
-20.59%
jan 1, 1982
13.352
-0.354
-2.59%
jan 1, 1983
14.454
+1.102
8.25%
jan 1, 1984
17.114
+2.66
18.41%
jan 1, 1985
18.592
+1.477
8.63%
jan 1, 1986
19.537
+0.945
5.08%
jan 1, 1987
24.111
+4.574
23.41%
jan 1, 1988
22.924
-1.187
-4.92%
jan 1, 1989
23.72
+0.796
3.47%
jan 1, 1990
22.863
-0.856
-3.61%
jan 1, 1991
20.612
-2.251
-9.85%
jan 1, 1992
21.441
+0.829
4.02%
jan 1, 1993
21.511
+0.07
0.32%
jan 1, 1994
22.65
+1.139
5.3%
jan 1, 1995
24.708
+2.057
9.08%
jan 1, 1996
25.58
+0.872
3.53%
jan 1, 1997
26.64
+1.06
4.14%
jan 1, 1998
35.649
+9.009
33.82%
jan 1, 1999
47.326
+11.677
32.75%
jan 1, 2000
46.087
-1.239
-2.62%
jan 1, 2001
37.46
-8.627
-18.72%
jan 1, 2002
40.13
+2.67
7.13%
jan 1, 2003
38.9
-1.231
-3.07%
jan 1, 2004
36.788
-2.112
-5.43%
jan 1, 2005
34.225
-2.563
-6.97%
jan 1, 2006
30.65
-3.575
-10.45%
jan 1, 2007
30.73
+0.08
0.26%
jan 1, 2008
35.551
+4.821
15.69%
jan 1, 2009
35.124
-0.427
-1.2%
jan 1, 2010
46.697
+11.573
32.95%
jan 1, 2011
42.351
-4.346
-9.31%
jan 1, 2012
41.183
-1.168
-2.76%
jan 1, 2013
41.967
+0.784
1.9%
jan 1, 2014
43.078
+1.111
2.65%
jan 1, 2015
46.897
+3.82
8.87%
jan 1, 2016
65.569
+18.672
39.81%
Ranking of countries by current statistics by years


Comments: