29
/
en
AIzaSyAYiBZKx7MnpbEhh9jyipgxe19OcubqV5w
April 1, 2024
59692
Sub-Saharan Africa (excluding high income)
SSA
false
2
1
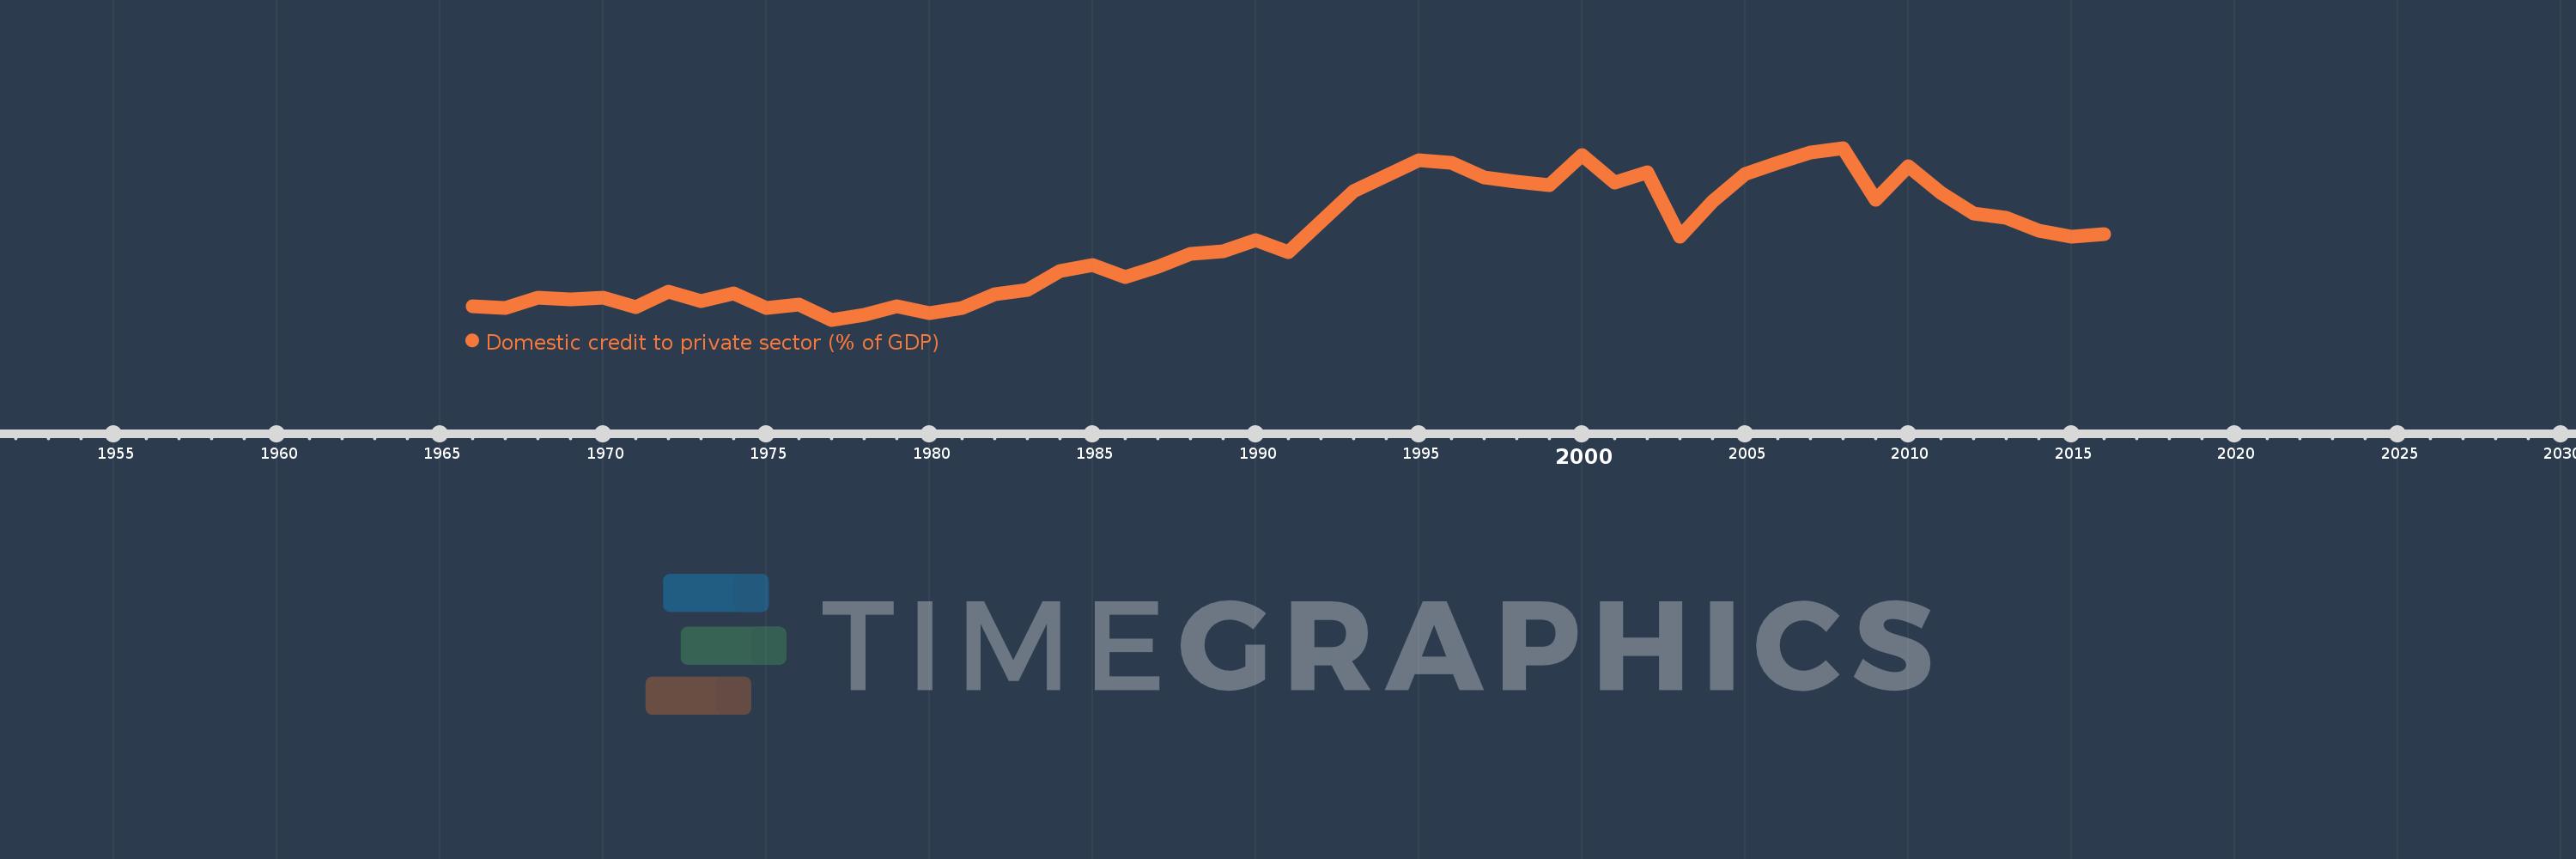
Domestic credit to private sector (% of GDP)
2016,2015,2014,2013,2012,2011,2010,2009,2008,2007,2006,2005,2004,2003,2002,2001,2000,1999,1998,1997,1996,1995,1994,1993,1991,1990,1989,1988,1987,1986,1985,1984,1983,1982,1981,1980,1979,1978,1977,1976,1975,1974,1973,1972,1971,1970,1969,1968,1967,1966
This statistics in other country:
AfghanistanAlbaniaAlgeriaAngolaAntigua and BarbudaArab WorldArgentinaArmeniaArubaAustraliaAustriaAzerbaijanBahamas, TheBahrainBangladeshBarbadosBelarusBelgiumBelizeBeninBhutanBoliviaBosnia and HerzegovinaBotswanaBrazilBrunei DarussalamBulgariaBurkina FasoBurundiCabo VerdeCambodiaCameroonCanadaCaribbean small statesCentral African RepublicCentral Europe and the BalticsChadChileChinaColombiaComorosCongo, Dem. Rep.Congo, Rep.Costa RicaCote d'IvoireCroatiaCyprusCzech RepublicDenmarkDjiboutiDominicaDominican RepublicEarly-demographic dividendEast Asia & PacificEast Asia & Pacific (excluding high income)East Asia & Pacific (IDA & IBRD countries)EcuadorEgypt, Arab Rep.El SalvadorEquatorial GuineaEritreaEstoniaEthiopiaEuro areaEurope & Central AsiaEurope & Central Asia (excluding high income)Europe & Central Asia (IDA & IBRD countries)European UnionFijiFinlandFragile and conflict affected situationsFranceGabonGambia, TheGeorgiaGermanyGhanaGreeceGrenadaGuatemalaGuineaGuinea-BissauGuyanaHaitiHeavily indebted poor countries (HIPC)High incomeHondurasHong Kong SAR, ChinaHungaryIBRD onlyIcelandIDA & IBRD totalIDA blendIDA onlyIDA totalIndiaIndonesiaIran, Islamic Rep.IraqIrelandIsraelItalyJamaicaJapanJordanKazakhstanKenyaKorea, Rep.KosovoKuwaitKyrgyz RepublicLao PDRLate-demographic dividendLatin America & Caribbean Latin America & Caribbean (excluding high income)Latin America & the Caribbean (IDA & IBRD countries)LatviaLeast developed countries: UN classificationLebanonLesothoLiberiaLibyaLithuaniaLow & middle incomeLow incomeLower middle incomeLuxembourgMacao SAR, ChinaMacedonia, FYRMadagascarMalawiMalaysiaMaldivesMaliMaltaMauritaniaMauritiusMexicoMicronesia, Fed. Sts.Middle East & North AfricaMiddle East & North Africa (excluding high income)Middle East & North Africa (IDA & IBRD countries)Middle incomeMoldovaMongoliaMontenegroMoroccoMozambiqueMyanmarNamibiaNepalNetherlandsNew ZealandNicaraguaNigerNigeriaNorth AmericaNorwayOECD membersOmanOther small statesPacific island small statesPakistanPanamaPapua New GuineaParaguayPeruPhilippinesPolandPortugalPost-demographic dividendPre-demographic dividendQatarRomaniaRussian FederationRwandaSamoaSao Tome and PrincipeSaudi ArabiaSenegalSerbiaSeychellesSierra LeoneSingaporeSlovak RepublicSloveniaSmall statesSolomon IslandsSouth AfricaSouth AsiaSouth Asia (IDA & IBRD)South SudanSpainSri LankaSt. Kitts and NevisSt. LuciaSt. Vincent and the GrenadinesSub-Saharan Africa Sub-Saharan Africa (excluding high income)Sub-Saharan Africa (IDA & IBRD countries)SudanSurinameSwazilandSwedenSwitzerlandSyrian Arab RepublicTajikistanTanzaniaThailandTimor-LesteTogoTongaTrinidad and TobagoTunisiaTurkeyUgandaUkraineUnited Arab EmiratesUnited KingdomUnited StatesUpper middle incomeUruguayVanuatuVenezuela, RBVietnamWest Bank and GazaWorldYemen, Rep.ZambiaZimbabwe Timeline:
This timeline shows a graph from 1966 to 2016 of Sub-Saharan Africa (excluding high income). No data until 1965. Number of actual observations by date: 50.
Source name:
World Development Indicators
Source organization:
International Monetary Fund, International Financial Statistics and data files, and World Bank and OECD GDP estimates.
Categories, topics:
Financial Sector, Private Sector
Last updated:
apr 23, 2017
Indicators value changes by year
Minimum:
27.999
jan 1, 1977
Maximum:
64.271
jan 1, 2008
At the date of observation
Value
Absolute change
Change from previous value
jan 1, 1966
30.787
+30.787
0.0%
jan 1, 1967
30.533
-0.254
-0.83%
jan 1, 1968
32.677
+2.144
7.02%
jan 1, 1969
32.258
-0.419
-1.28%
jan 1, 1970
32.591
+0.333
1.03%
jan 1, 1971
30.593
-1.998
-6.13%
jan 1, 1972
33.97
+3.377
11.04%
jan 1, 1973
31.958
-2.012
-5.92%
jan 1, 1974
33.581
+1.623
5.08%
jan 1, 1975
30.497
-3.084
-9.18%
jan 1, 1976
31.265
+0.768
2.52%
jan 1, 1977
27.999
-3.266
-10.45%
jan 1, 1978
28.995
+0.995
3.55%
jan 1, 1979
30.762
+1.767
6.1%
jan 1, 1980
29.422
-1.34
-4.36%
jan 1, 1981
30.476
+1.054
3.58%
jan 1, 1982
33.313
+2.838
9.31%
jan 1, 1983
34.345
+1.032
3.1%
jan 1, 1984
38.333
+3.988
11.61%
jan 1, 1985
39.581
+1.248
3.26%
jan 1, 1986
36.969
-2.611
-6.6%
jan 1, 1987
39.233
+2.264
6.12%
jan 1, 1988
41.908
+2.675
6.82%
jan 1, 1989
42.395
+0.487
1.16%
jan 1, 1990
44.847
+2.452
5.78%
jan 1, 1991
42.33
-2.518
-5.61%
jan 1, 1993
55.176
+12.846
30.35%
jan 1, 1994
58.384
+3.208
5.81%
jan 1, 1995
61.623
+3.239
5.55%
jan 1, 1996
61.07
-0.554
-0.9%
jan 1, 1997
58.102
-2.968
-4.86%
jan 1, 1998
57.204
-0.898
-1.55%
jan 1, 1999
56.466
-0.738
-1.29%
jan 1, 2000
62.814
+6.349
11.24%
jan 1, 2001
57.04
-5.775
-9.19%
jan 1, 2002
59.089
+2.049
3.59%
jan 1, 2003
45.537
-13.552
-22.93%
jan 1, 2004
52.948
+7.411
16.27%
jan 1, 2005
58.859
+5.911
11.16%
jan 1, 2006
61.136
+2.278
3.87%
jan 1, 2007
63.392
+2.255
3.69%
jan 1, 2008
64.271
+0.88
1.39%
jan 1, 2009
53.367
-10.904
-16.97%
jan 1, 2010
60.458
+7.091
13.29%
jan 1, 2011
54.721
-5.738
-9.49%
jan 1, 2012
50.419
-4.302
-7.86%
jan 1, 2013
49.457
-0.962
-1.91%
jan 1, 2014
46.76
-2.697
-5.45%
jan 1, 2015
45.462
-1.298
-2.78%
jan 1, 2016
45.999
+0.537
1.18%
Ranking of countries by current statistics by years


Comments: