29
/
en
AIzaSyAYiBZKx7MnpbEhh9jyipgxe19OcubqV5w
April 1, 2024
164689
Jordan
JOR
true
2
1
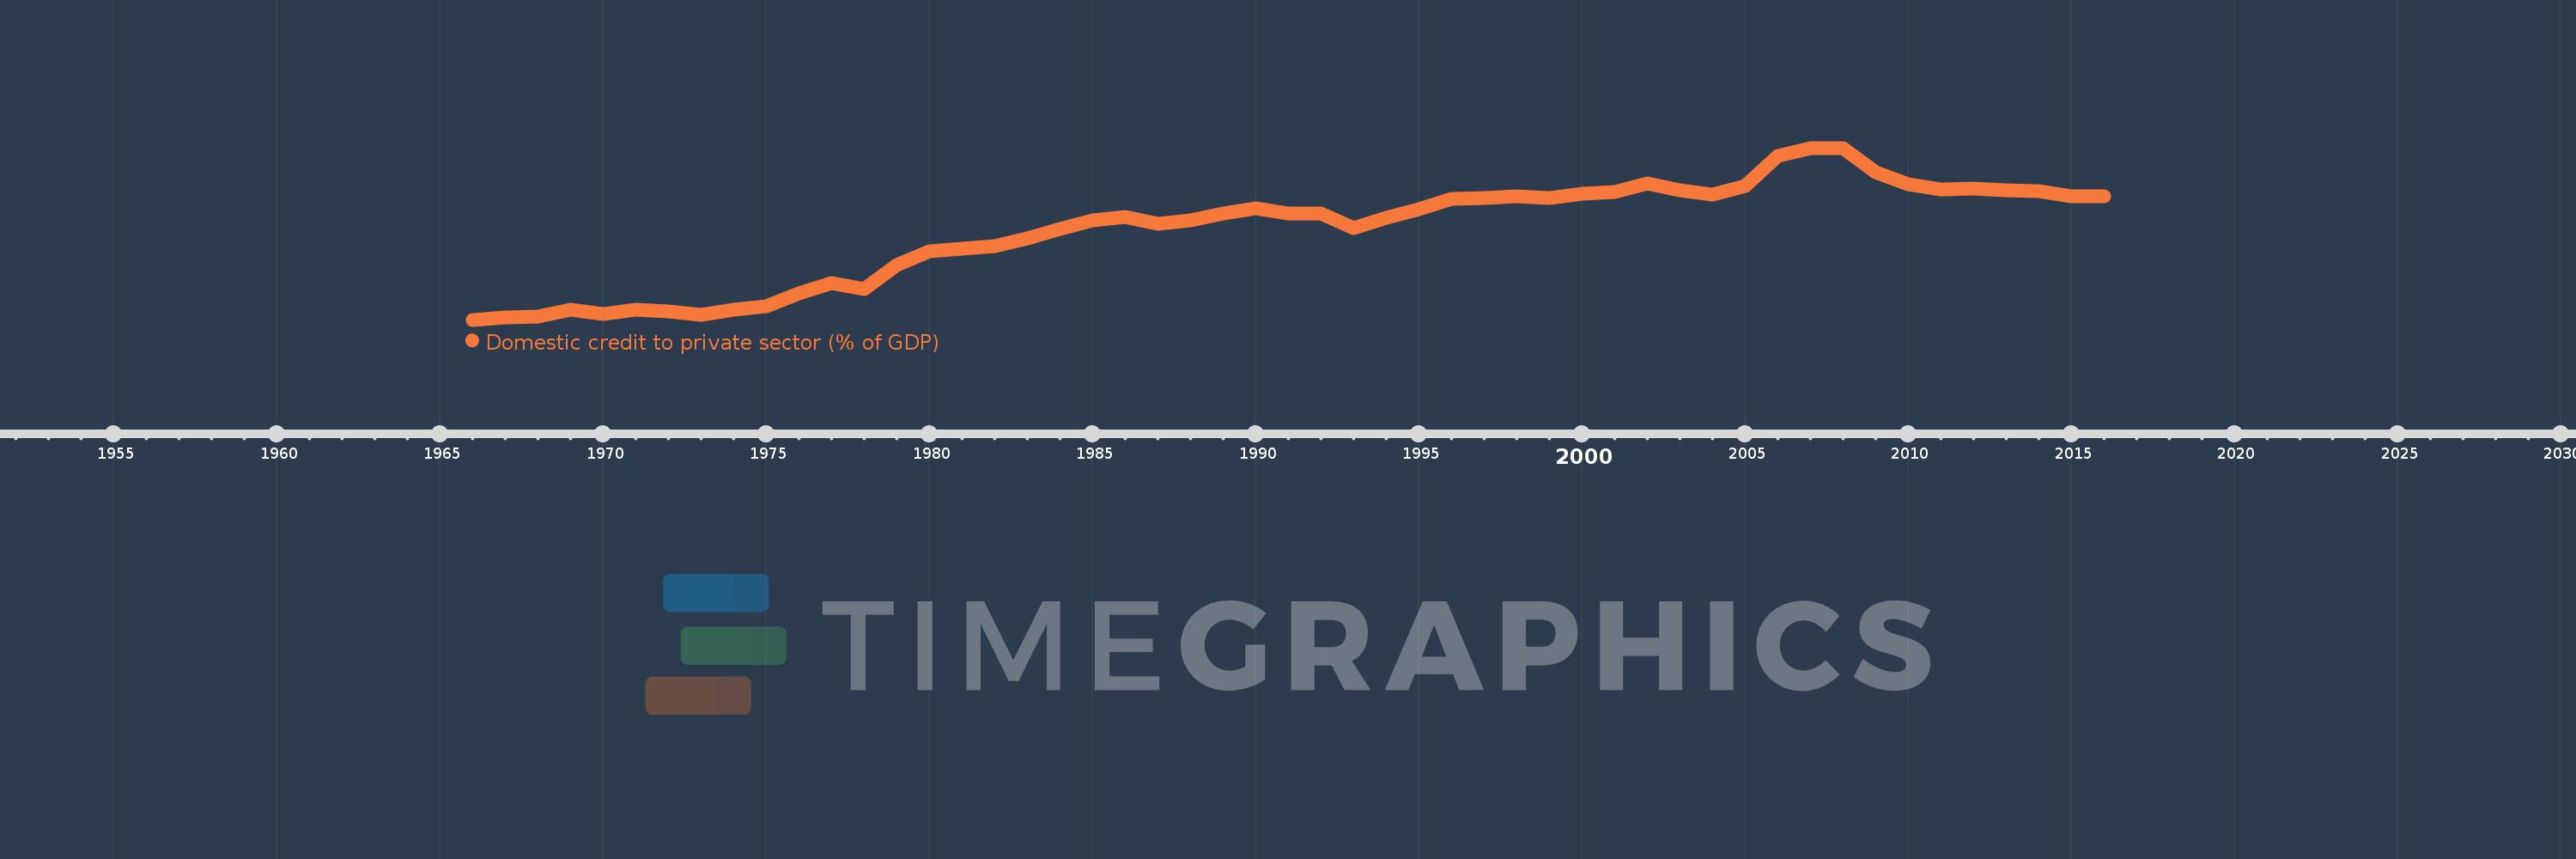
Domestic credit to private sector (% of GDP)
2016,2015,2014,2013,2012,2011,2010,2009,2008,2007,2006,2005,2004,2003,2002,2001,2000,1999,1998,1997,1996,1995,1994,1993,1992,1991,1990,1989,1988,1987,1986,1985,1984,1983,1982,1981,1980,1979,1978,1977,1976,1975,1974,1973,1972,1971,1970,1969,1968,1967,1966
This statistics in other country:
AfghanistanAlbaniaAlgeriaAngolaAntigua and BarbudaArab WorldArgentinaArmeniaArubaAustraliaAustriaAzerbaijanBahamas, TheBahrainBangladeshBarbadosBelarusBelgiumBelizeBeninBhutanBoliviaBosnia and HerzegovinaBotswanaBrazilBrunei DarussalamBulgariaBurkina FasoBurundiCabo VerdeCambodiaCameroonCanadaCaribbean small statesCentral African RepublicCentral Europe and the BalticsChadChileChinaColombiaComorosCongo, Dem. Rep.Congo, Rep.Costa RicaCote d'IvoireCroatiaCyprusCzech RepublicDenmarkDjiboutiDominicaDominican RepublicEarly-demographic dividendEast Asia & PacificEast Asia & Pacific (excluding high income)East Asia & Pacific (IDA & IBRD countries)EcuadorEgypt, Arab Rep.El SalvadorEquatorial GuineaEritreaEstoniaEthiopiaEuro areaEurope & Central AsiaEurope & Central Asia (excluding high income)Europe & Central Asia (IDA & IBRD countries)European UnionFijiFinlandFragile and conflict affected situationsFranceGabonGambia, TheGeorgiaGermanyGhanaGreeceGrenadaGuatemalaGuineaGuinea-BissauGuyanaHaitiHeavily indebted poor countries (HIPC)High incomeHondurasHong Kong SAR, ChinaHungaryIBRD onlyIcelandIDA & IBRD totalIDA blendIDA onlyIDA totalIndiaIndonesiaIran, Islamic Rep.IraqIrelandIsraelItalyJamaicaJapanJordanKazakhstanKenyaKorea, Rep.KosovoKuwaitKyrgyz RepublicLao PDRLate-demographic dividendLatin America & Caribbean Latin America & Caribbean (excluding high income)Latin America & the Caribbean (IDA & IBRD countries)LatviaLeast developed countries: UN classificationLebanonLesothoLiberiaLibyaLithuaniaLow & middle incomeLow incomeLower middle incomeLuxembourgMacao SAR, ChinaMacedonia, FYRMadagascarMalawiMalaysiaMaldivesMaliMaltaMauritaniaMauritiusMexicoMicronesia, Fed. Sts.Middle East & North AfricaMiddle East & North Africa (excluding high income)Middle East & North Africa (IDA & IBRD countries)Middle incomeMoldovaMongoliaMontenegroMoroccoMozambiqueMyanmarNamibiaNepalNetherlandsNew ZealandNicaraguaNigerNigeriaNorth AmericaNorwayOECD membersOmanOther small statesPacific island small statesPakistanPanamaPapua New GuineaParaguayPeruPhilippinesPolandPortugalPost-demographic dividendPre-demographic dividendQatarRomaniaRussian FederationRwandaSamoaSao Tome and PrincipeSaudi ArabiaSenegalSerbiaSeychellesSierra LeoneSingaporeSlovak RepublicSloveniaSmall statesSolomon IslandsSouth AfricaSouth AsiaSouth Asia (IDA & IBRD)South SudanSpainSri LankaSt. Kitts and NevisSt. LuciaSt. Vincent and the GrenadinesSub-Saharan Africa Sub-Saharan Africa (excluding high income)Sub-Saharan Africa (IDA & IBRD countries)SudanSurinameSwazilandSwedenSwitzerlandSyrian Arab RepublicTajikistanTanzaniaThailandTimor-LesteTogoTongaTrinidad and TobagoTunisiaTurkeyUgandaUkraineUnited Arab EmiratesUnited KingdomUnited StatesUpper middle incomeUruguayVanuatuVenezuela, RBVietnamWest Bank and GazaWorldYemen, Rep.ZambiaZimbabwe Timeline:
This timeline shows a graph from 1966 to 2016 of Jordan. No data until 1965. Number of actual observations by date: 51.
Source name:
World Development Indicators
Source organization:
International Monetary Fund, International Financial Statistics and data files, and World Bank and OECD GDP estimates.
Categories, topics:
Financial Sector, Private Sector
Last updated:
apr 23, 2017
Indicators value changes by year
Minimum:
14.772
jan 1, 1966
Maximum:
91.769
jan 1, 2007
At the date of observation
Value
Absolute change
Change from previous value
jan 1, 1966
14.772
+14.772
0.0%
jan 1, 1967
15.828
+1.056
7.15%
jan 1, 1968
16.346
+0.518
3.27%
jan 1, 1969
19.121
+2.775
16.98%
jan 1, 1970
17.415
-1.706
-8.92%
jan 1, 1971
19.095
+1.68
9.65%
jan 1, 1972
18.546
-0.549
-2.88%
jan 1, 1973
17.022
-1.524
-8.22%
jan 1, 1974
19.126
+2.104
12.36%
jan 1, 1975
20.814
+1.688
8.83%
jan 1, 1976
26.524
+5.71
27.43%
jan 1, 1977
31.243
+4.719
17.79%
jan 1, 1978
28.572
-2.671
-8.55%
jan 1, 1979
39.446
+10.874
38.06%
jan 1, 1980
45.292
+5.846
14.82%
jan 1, 1981
46.501
+1.209
2.67%
jan 1, 1982
47.706
+1.205
2.59%
jan 1, 1983
51.093
+3.387
7.1%
jan 1, 1984
55.596
+4.503
8.81%
jan 1, 1985
59.356
+3.761
6.76%
jan 1, 1986
60.749
+1.393
2.35%
jan 1, 1987
57.854
-2.896
-4.77%
jan 1, 1988
59.239
+1.385
2.39%
jan 1, 1989
62.454
+3.215
5.43%
jan 1, 1990
64.665
+2.211
3.54%
jan 1, 1991
62.278
-2.387
-3.69%
jan 1, 1992
62.362
+0.084
0.14%
jan 1, 1993
55.892
-6.47
-10.37%
jan 1, 1994
60.66
+4.768
8.53%
jan 1, 1995
64.486
+3.827
6.31%
jan 1, 1996
68.864
+4.378
6.79%
jan 1, 1997
69.355
+0.491
0.71%
jan 1, 1998
70.005
+0.65
0.94%
jan 1, 1999
69.141
-0.864
-1.23%
jan 1, 2000
71.409
+2.268
3.28%
jan 1, 2001
72.112
+0.703
0.98%
jan 1, 2002
75.729
+3.617
5.02%
jan 1, 2003
72.756
-2.973
-3.93%
jan 1, 2004
70.818
-1.937
-2.66%
jan 1, 2005
74.726
+3.908
5.52%
jan 1, 2006
88.094
+13.368
17.89%
jan 1, 2007
91.769
+3.675
4.17%
jan 1, 2008
91.631
-0.138
-0.15%
jan 1, 2009
80.883
-10.748
-11.73%
jan 1, 2010
75.535
-5.348
-6.61%
jan 1, 2011
73.165
-2.37
-3.14%
jan 1, 2012
73.529
+0.364
0.5%
jan 1, 2013
72.896
-0.633
-0.86%
jan 1, 2014
72.334
-0.562
-0.77%
jan 1, 2015
70.216
-2.118
-2.93%
jan 1, 2016
70.252
+0.036
0.05%
Ranking of countries by current statistics by years


Comments: