29
/
en
AIzaSyAYiBZKx7MnpbEhh9jyipgxe19OcubqV5w
April 1, 2024
42270
Latin America & Caribbean (excluding high income)
LAC
false
2
1
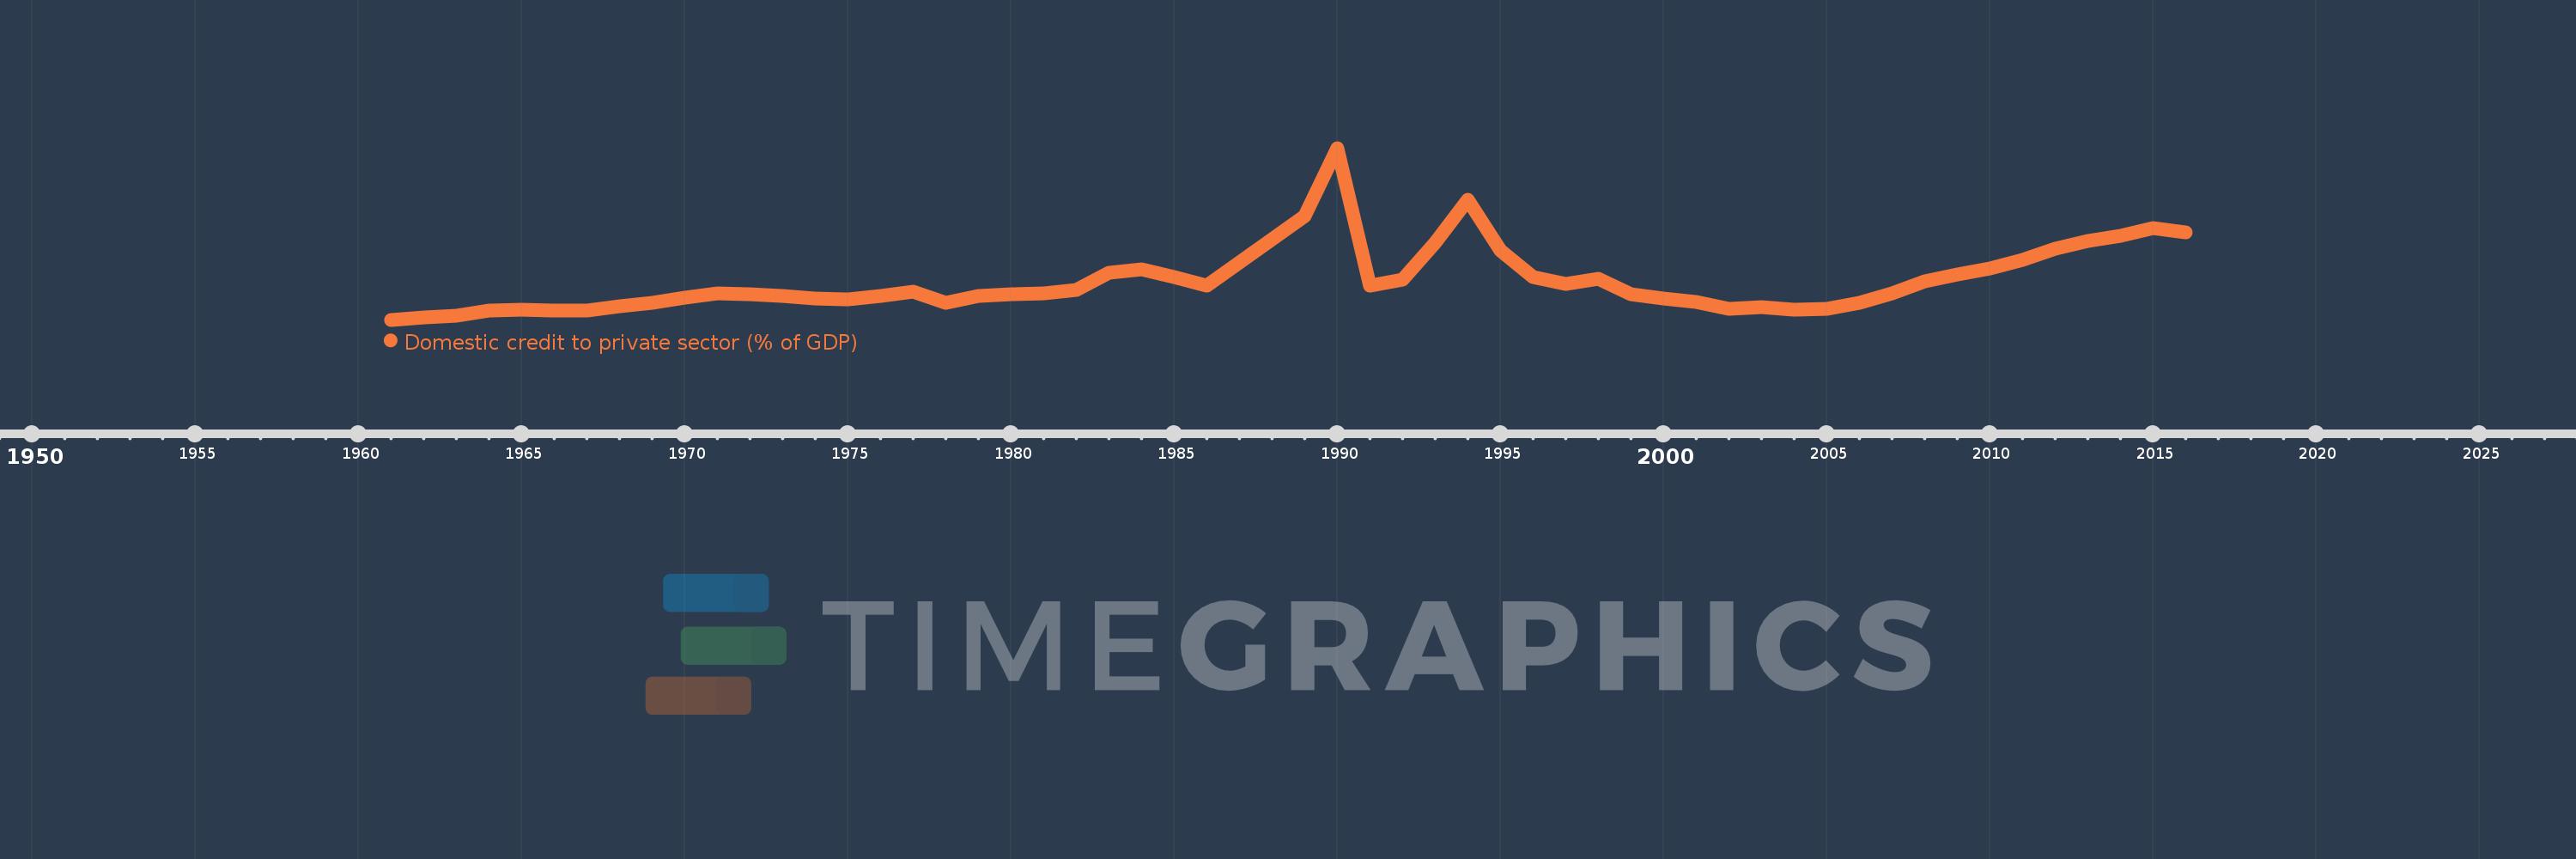
Domestic credit to private sector (% of GDP)
2016,2015,2014,2013,2012,2011,2010,2009,2008,2007,2006,2005,2004,2003,2002,2001,2000,1999,1998,1997,1996,1995,1994,1993,1992,1991,1990,1989,1986,1985,1984,1983,1982,1981,1980,1979,1978,1977,1976,1975,1974,1973,1972,1971,1970,1969,1968,1967,1966,1965,1964,1963,1962,1961
This statistics in other country:
AfghanistanAlbaniaAlgeriaAngolaAntigua and BarbudaArab WorldArgentinaArmeniaArubaAustraliaAustriaAzerbaijanBahamas, TheBahrainBangladeshBarbadosBelarusBelgiumBelizeBeninBhutanBoliviaBosnia and HerzegovinaBotswanaBrazilBrunei DarussalamBulgariaBurkina FasoBurundiCabo VerdeCambodiaCameroonCanadaCaribbean small statesCentral African RepublicCentral Europe and the BalticsChadChileChinaColombiaComorosCongo, Dem. Rep.Congo, Rep.Costa RicaCote d'IvoireCroatiaCyprusCzech RepublicDenmarkDjiboutiDominicaDominican RepublicEarly-demographic dividendEast Asia & PacificEast Asia & Pacific (excluding high income)East Asia & Pacific (IDA & IBRD countries)EcuadorEgypt, Arab Rep.El SalvadorEquatorial GuineaEritreaEstoniaEthiopiaEuro areaEurope & Central AsiaEurope & Central Asia (excluding high income)Europe & Central Asia (IDA & IBRD countries)European UnionFijiFinlandFragile and conflict affected situationsFranceGabonGambia, TheGeorgiaGermanyGhanaGreeceGrenadaGuatemalaGuineaGuinea-BissauGuyanaHaitiHeavily indebted poor countries (HIPC)High incomeHondurasHong Kong SAR, ChinaHungaryIBRD onlyIcelandIDA & IBRD totalIDA blendIDA onlyIDA totalIndiaIndonesiaIran, Islamic Rep.IraqIrelandIsraelItalyJamaicaJapanJordanKazakhstanKenyaKorea, Rep.KosovoKuwaitKyrgyz RepublicLao PDRLate-demographic dividendLatin America & Caribbean Latin America & Caribbean (excluding high income)Latin America & the Caribbean (IDA & IBRD countries)LatviaLeast developed countries: UN classificationLebanonLesothoLiberiaLibyaLithuaniaLow & middle incomeLow incomeLower middle incomeLuxembourgMacao SAR, ChinaMacedonia, FYRMadagascarMalawiMalaysiaMaldivesMaliMaltaMauritaniaMauritiusMexicoMicronesia, Fed. Sts.Middle East & North AfricaMiddle East & North Africa (excluding high income)Middle East & North Africa (IDA & IBRD countries)Middle incomeMoldovaMongoliaMontenegroMoroccoMozambiqueMyanmarNamibiaNepalNetherlandsNew ZealandNicaraguaNigerNigeriaNorth AmericaNorwayOECD membersOmanOther small statesPacific island small statesPakistanPanamaPapua New GuineaParaguayPeruPhilippinesPolandPortugalPost-demographic dividendPre-demographic dividendQatarRomaniaRussian FederationRwandaSamoaSao Tome and PrincipeSaudi ArabiaSenegalSerbiaSeychellesSierra LeoneSingaporeSlovak RepublicSloveniaSmall statesSolomon IslandsSouth AfricaSouth AsiaSouth Asia (IDA & IBRD)South SudanSpainSri LankaSt. Kitts and NevisSt. LuciaSt. Vincent and the GrenadinesSub-Saharan Africa Sub-Saharan Africa (excluding high income)Sub-Saharan Africa (IDA & IBRD countries)SudanSurinameSwazilandSwedenSwitzerlandSyrian Arab RepublicTajikistanTanzaniaThailandTimor-LesteTogoTongaTrinidad and TobagoTunisiaTurkeyUgandaUkraineUnited Arab EmiratesUnited KingdomUnited StatesUpper middle incomeUruguayVanuatuVenezuela, RBVietnamWest Bank and GazaWorldYemen, Rep.ZambiaZimbabwe Timeline:
This timeline shows a graph from 1961 to 2016 of Latin America & Caribbean (excluding high income). No data until 1960. Number of actual observations by date: 54.
Source name:
World Development Indicators
Source organization:
International Monetary Fund, International Financial Statistics and data files, and World Bank and OECD GDP estimates.
Categories, topics:
Financial Sector, Private Sector
Last updated:
apr 23, 2017
Indicators value changes by year
Minimum:
17.544
jan 1, 1961
Maximum:
74.738
jan 1, 1990
At the date of observation
Value
Absolute change
Change from previous value
jan 1, 1961
17.544
+17.544
0.0%
jan 1, 1962
18.213
+0.669
3.81%
jan 1, 1963
18.814
+0.601
3.3%
jan 1, 1964
20.724
+1.91
10.15%
jan 1, 1965
20.819
+0.095
0.46%
jan 1, 1966
20.642
-0.176
-0.85%
jan 1, 1967
20.692
+0.05
0.24%
jan 1, 1968
22.153
+1.461
7.06%
jan 1, 1969
23.229
+1.076
4.86%
jan 1, 1970
25.03
+1.802
7.76%
jan 1, 1971
26.297
+1.266
5.06%
jan 1, 1972
25.996
-0.301
-1.14%
jan 1, 1973
25.576
-0.42
-1.62%
jan 1, 1974
24.537
-1.039
-4.06%
jan 1, 1975
24.276
-0.261
-1.07%
jan 1, 1976
25.345
+1.069
4.41%
jan 1, 1977
26.83
+1.485
5.86%
jan 1, 1978
23.291
-3.539
-13.19%
jan 1, 1979
25.471
+2.18
9.36%
jan 1, 1980
25.925
+0.453
1.78%
jan 1, 1981
26.206
+0.281
1.08%
jan 1, 1982
27.456
+1.25
4.77%
jan 1, 1983
33.169
+5.713
20.81%
jan 1, 1984
34.25
+1.081
3.26%
jan 1, 1985
31.652
-2.598
-7.58%
jan 1, 1986
28.936
-2.717
-8.58%
jan 1, 1989
52.063
+23.127
79.93%
jan 1, 1990
74.738
+22.675
43.55%
jan 1, 1991
28.997
-45.74
-61.2%
jan 1, 1992
30.855
+1.858
6.41%
jan 1, 1993
43.145
+12.29
39.83%
jan 1, 1994
57.426
+14.28
33.1%
jan 1, 1995
40.479
-16.947
-29.51%
jan 1, 1996
31.851
-8.627
-21.31%
jan 1, 1997
29.567
-2.284
-7.17%
jan 1, 1998
31.225
+1.657
5.61%
jan 1, 1999
26.122
-5.103
-16.34%
jan 1, 2000
24.589
-1.533
-5.87%
jan 1, 2001
23.561
-1.028
-4.18%
jan 1, 2002
21.283
-2.278
-9.67%
jan 1, 2003
21.667
+0.384
1.8%
jan 1, 2004
21.004
-0.663
-3.06%
jan 1, 2005
21.234
+0.23
1.1%
jan 1, 2006
23.228
+1.993
9.39%
jan 1, 2007
26.367
+3.14
13.52%
jan 1, 2008
30.455
+4.088
15.5%
jan 1, 2009
32.523
+2.067
6.79%
jan 1, 2010
34.622
+2.099
6.45%
jan 1, 2011
37.573
+2.952
8.53%
jan 1, 2012
41.317
+3.744
9.96%
jan 1, 2013
43.72
+2.403
5.82%
jan 1, 2014
45.463
+1.743
3.99%
jan 1, 2015
48.054
+2.591
5.7%
jan 1, 2016
46.723
-1.331
-2.77%
Ranking of countries by current statistics by years


Comments: