29
/
en
AIzaSyAYiBZKx7MnpbEhh9jyipgxe19OcubqV5w
April 1, 2024
167339
Kenya
KEN
true
2
1
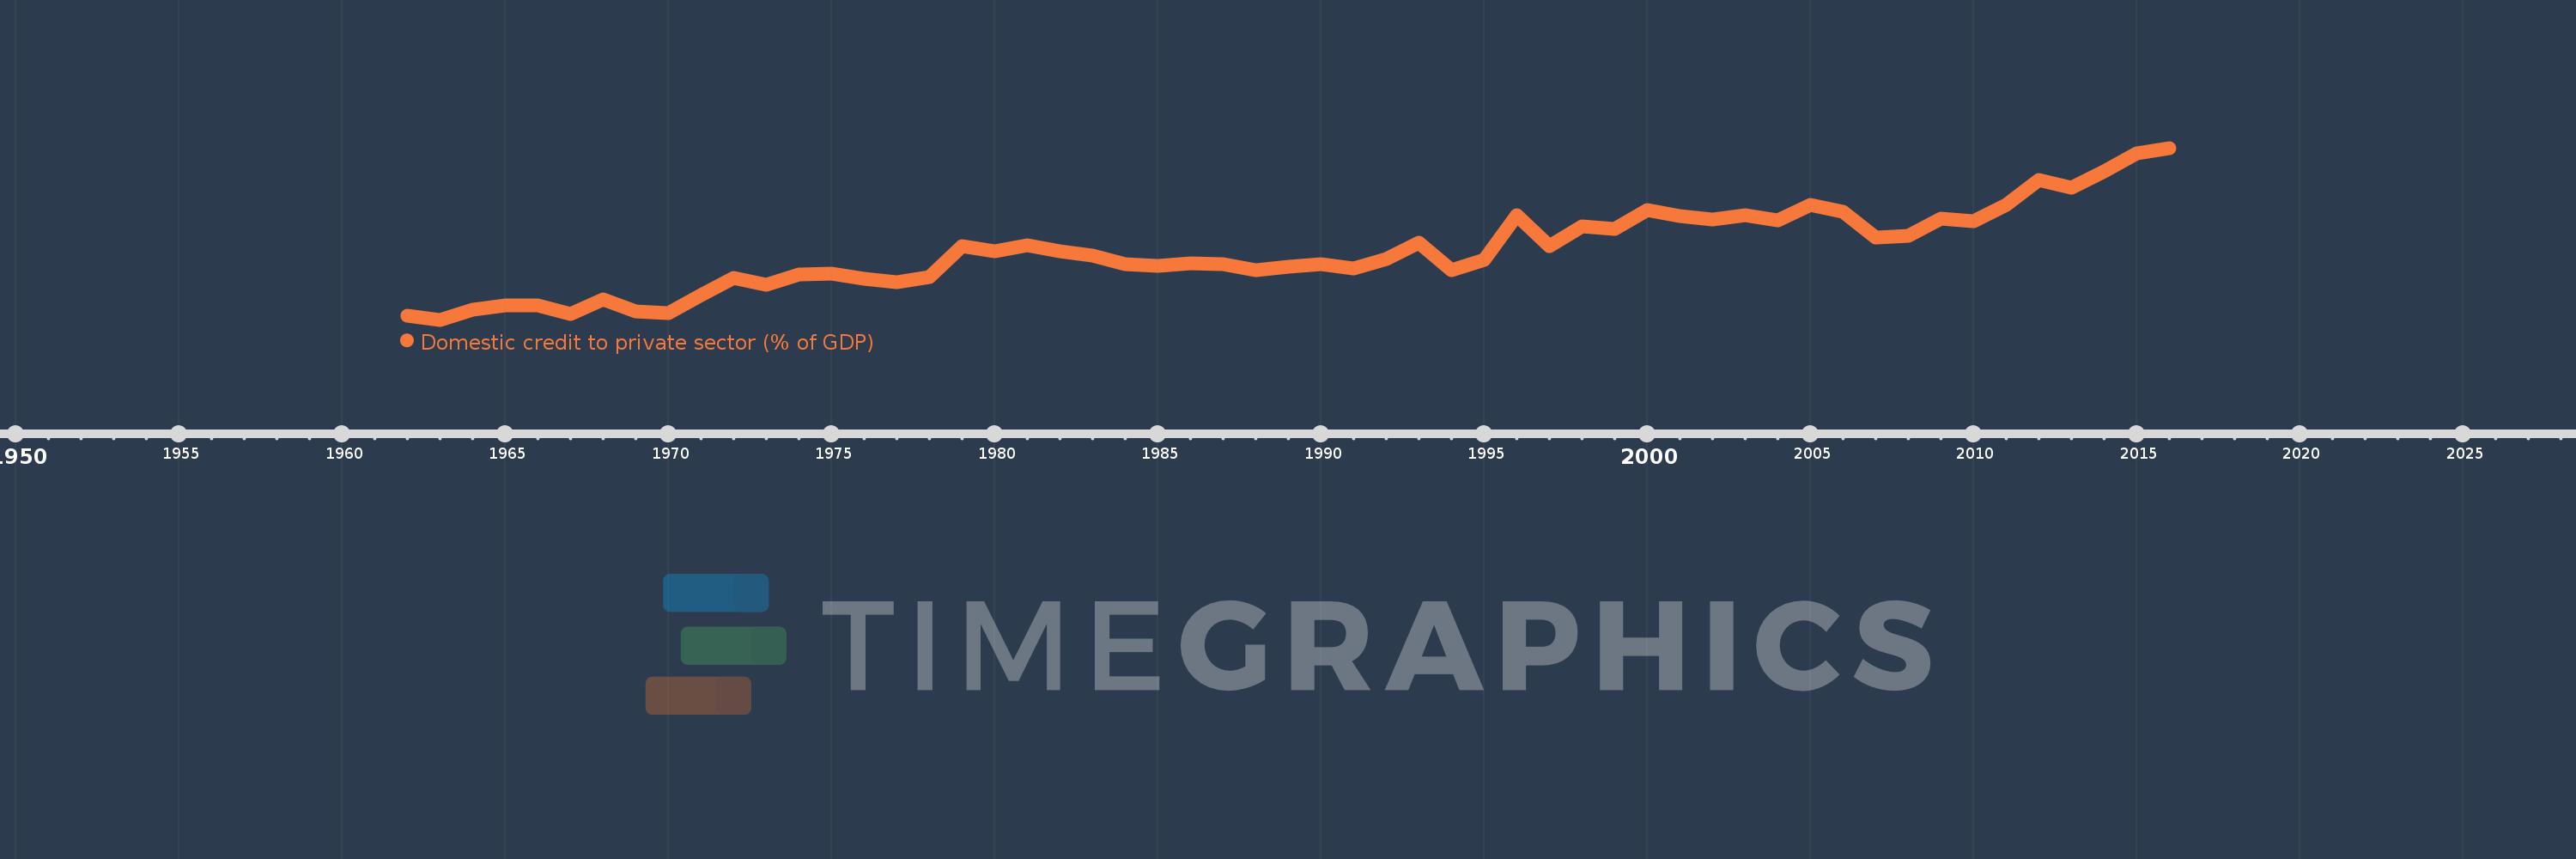
Domestic credit to private sector (% of GDP)
2016,2015,2014,2013,2012,2011,2010,2009,2008,2007,2006,2005,2004,2003,2002,2001,2000,1999,1998,1997,1996,1995,1994,1993,1992,1991,1990,1989,1988,1987,1986,1985,1984,1983,1982,1981,1980,1979,1978,1977,1976,1975,1974,1973,1972,1971,1970,1969,1968,1967,1966,1965,1964,1963,1962
This statistics in other country:
AfghanistanAlbaniaAlgeriaAngolaAntigua and BarbudaArab WorldArgentinaArmeniaArubaAustraliaAustriaAzerbaijanBahamas, TheBahrainBangladeshBarbadosBelarusBelgiumBelizeBeninBhutanBoliviaBosnia and HerzegovinaBotswanaBrazilBrunei DarussalamBulgariaBurkina FasoBurundiCabo VerdeCambodiaCameroonCanadaCaribbean small statesCentral African RepublicCentral Europe and the BalticsChadChileChinaColombiaComorosCongo, Dem. Rep.Congo, Rep.Costa RicaCote d'IvoireCroatiaCyprusCzech RepublicDenmarkDjiboutiDominicaDominican RepublicEarly-demographic dividendEast Asia & PacificEast Asia & Pacific (excluding high income)East Asia & Pacific (IDA & IBRD countries)EcuadorEgypt, Arab Rep.El SalvadorEquatorial GuineaEritreaEstoniaEthiopiaEuro areaEurope & Central AsiaEurope & Central Asia (excluding high income)Europe & Central Asia (IDA & IBRD countries)European UnionFijiFinlandFragile and conflict affected situationsFranceGabonGambia, TheGeorgiaGermanyGhanaGreeceGrenadaGuatemalaGuineaGuinea-BissauGuyanaHaitiHeavily indebted poor countries (HIPC)High incomeHondurasHong Kong SAR, ChinaHungaryIBRD onlyIcelandIDA & IBRD totalIDA blendIDA onlyIDA totalIndiaIndonesiaIran, Islamic Rep.IraqIrelandIsraelItalyJamaicaJapanJordanKazakhstanKenyaKorea, Rep.KosovoKuwaitKyrgyz RepublicLao PDRLate-demographic dividendLatin America & Caribbean Latin America & Caribbean (excluding high income)Latin America & the Caribbean (IDA & IBRD countries)LatviaLeast developed countries: UN classificationLebanonLesothoLiberiaLibyaLithuaniaLow & middle incomeLow incomeLower middle incomeLuxembourgMacao SAR, ChinaMacedonia, FYRMadagascarMalawiMalaysiaMaldivesMaliMaltaMauritaniaMauritiusMexicoMicronesia, Fed. Sts.Middle East & North AfricaMiddle East & North Africa (excluding high income)Middle East & North Africa (IDA & IBRD countries)Middle incomeMoldovaMongoliaMontenegroMoroccoMozambiqueMyanmarNamibiaNepalNetherlandsNew ZealandNicaraguaNigerNigeriaNorth AmericaNorwayOECD membersOmanOther small statesPacific island small statesPakistanPanamaPapua New GuineaParaguayPeruPhilippinesPolandPortugalPost-demographic dividendPre-demographic dividendQatarRomaniaRussian FederationRwandaSamoaSao Tome and PrincipeSaudi ArabiaSenegalSerbiaSeychellesSierra LeoneSingaporeSlovak RepublicSloveniaSmall statesSolomon IslandsSouth AfricaSouth AsiaSouth Asia (IDA & IBRD)South SudanSpainSri LankaSt. Kitts and NevisSt. LuciaSt. Vincent and the GrenadinesSub-Saharan Africa Sub-Saharan Africa (excluding high income)Sub-Saharan Africa (IDA & IBRD countries)SudanSurinameSwazilandSwedenSwitzerlandSyrian Arab RepublicTajikistanTanzaniaThailandTimor-LesteTogoTongaTrinidad and TobagoTunisiaTurkeyUgandaUkraineUnited Arab EmiratesUnited KingdomUnited StatesUpper middle incomeUruguayVanuatuVenezuela, RBVietnamWest Bank and GazaWorldYemen, Rep.ZambiaZimbabwe Timeline:
This timeline shows a graph from 1962 to 2016 of Kenya. No data until 1961. Number of actual observations by date: 55.
Source name:
World Development Indicators
Source organization:
International Monetary Fund, International Financial Statistics and data files, and World Bank and OECD GDP estimates.
Categories, topics:
Financial Sector, Private Sector
Last updated:
apr 23, 2017
Indicators value changes by year
Minimum:
11.805
jan 1, 1963
Maximum:
34.887
jan 1, 2016
At the date of observation
Value
Absolute change
Change from previous value
jan 1, 1962
12.306
+12.306
0.0%
jan 1, 1963
11.805
-0.501
-4.07%
jan 1, 1964
13.175
+1.37
11.61%
jan 1, 1965
13.695
+0.52
3.95%
jan 1, 1966
13.763
+0.068
0.49%
jan 1, 1967
12.611
-1.151
-8.37%
jan 1, 1968
14.584
+1.973
15.65%
jan 1, 1969
12.89
-1.694
-11.62%
jan 1, 1970
12.729
-0.161
-1.25%
jan 1, 1971
15.119
+2.39
18.77%
jan 1, 1972
17.433
+2.314
15.3%
jan 1, 1973
16.486
-0.946
-5.43%
jan 1, 1974
17.893
+1.407
8.54%
jan 1, 1975
17.976
+0.083
0.46%
jan 1, 1976
17.333
-0.643
-3.58%
jan 1, 1977
16.827
-0.506
-2.92%
jan 1, 1978
17.509
+0.682
4.05%
jan 1, 1979
21.712
+4.203
24.01%
jan 1, 1980
20.973
-0.739
-3.4%
jan 1, 1981
21.812
+0.839
4.0%
jan 1, 1982
21.003
-0.809
-3.71%
jan 1, 1983
20.437
-0.566
-2.7%
jan 1, 1984
19.323
-1.114
-5.45%
jan 1, 1985
18.986
-0.337
-1.74%
jan 1, 1986
19.334
+0.348
1.83%
jan 1, 1987
19.312
-0.022
-0.11%
jan 1, 1988
18.416
-0.896
-4.64%
jan 1, 1989
18.926
+0.51
2.77%
jan 1, 1990
19.224
+0.298
1.58%
jan 1, 1991
18.657
-0.568
-2.95%
jan 1, 1992
19.958
+1.302
6.98%
jan 1, 1993
22.152
+2.194
10.99%
jan 1, 1994
18.496
-3.656
-16.5%
jan 1, 1995
19.834
+1.338
7.23%
jan 1, 1996
25.814
+5.98
30.15%
jan 1, 1997
21.682
-4.132
-16.01%
jan 1, 1998
24.355
+2.674
12.33%
jan 1, 1999
23.963
-0.392
-1.61%
jan 1, 2000
26.569
+2.606
10.88%
jan 1, 2001
25.758
-0.811
-3.05%
jan 1, 2002
25.223
-0.536
-2.08%
jan 1, 2003
25.855
+0.632
2.51%
jan 1, 2004
25.156
-0.699
-2.7%
jan 1, 2005
27.288
+2.132
8.47%
jan 1, 2006
26.277
-1.011
-3.7%
jan 1, 2007
22.888
-3.389
-12.9%
jan 1, 2008
23.045
+0.157
0.68%
jan 1, 2009
25.381
+2.336
10.14%
jan 1, 2010
25.022
-0.359
-1.41%
jan 1, 2011
27.228
+2.207
8.82%
jan 1, 2012
30.573
+3.344
12.28%
jan 1, 2013
29.538
-1.035
-3.39%
jan 1, 2014
31.711
+2.173
7.36%
jan 1, 2015
34.163
+2.452
7.73%
jan 1, 2016
34.887
+0.724
2.12%
Ranking of countries by current statistics by years


Comments: