29
/
en
AIzaSyAYiBZKx7MnpbEhh9jyipgxe19OcubqV5w
April 1, 2024
30580
Europe & Central Asia
ECS
false
2
1
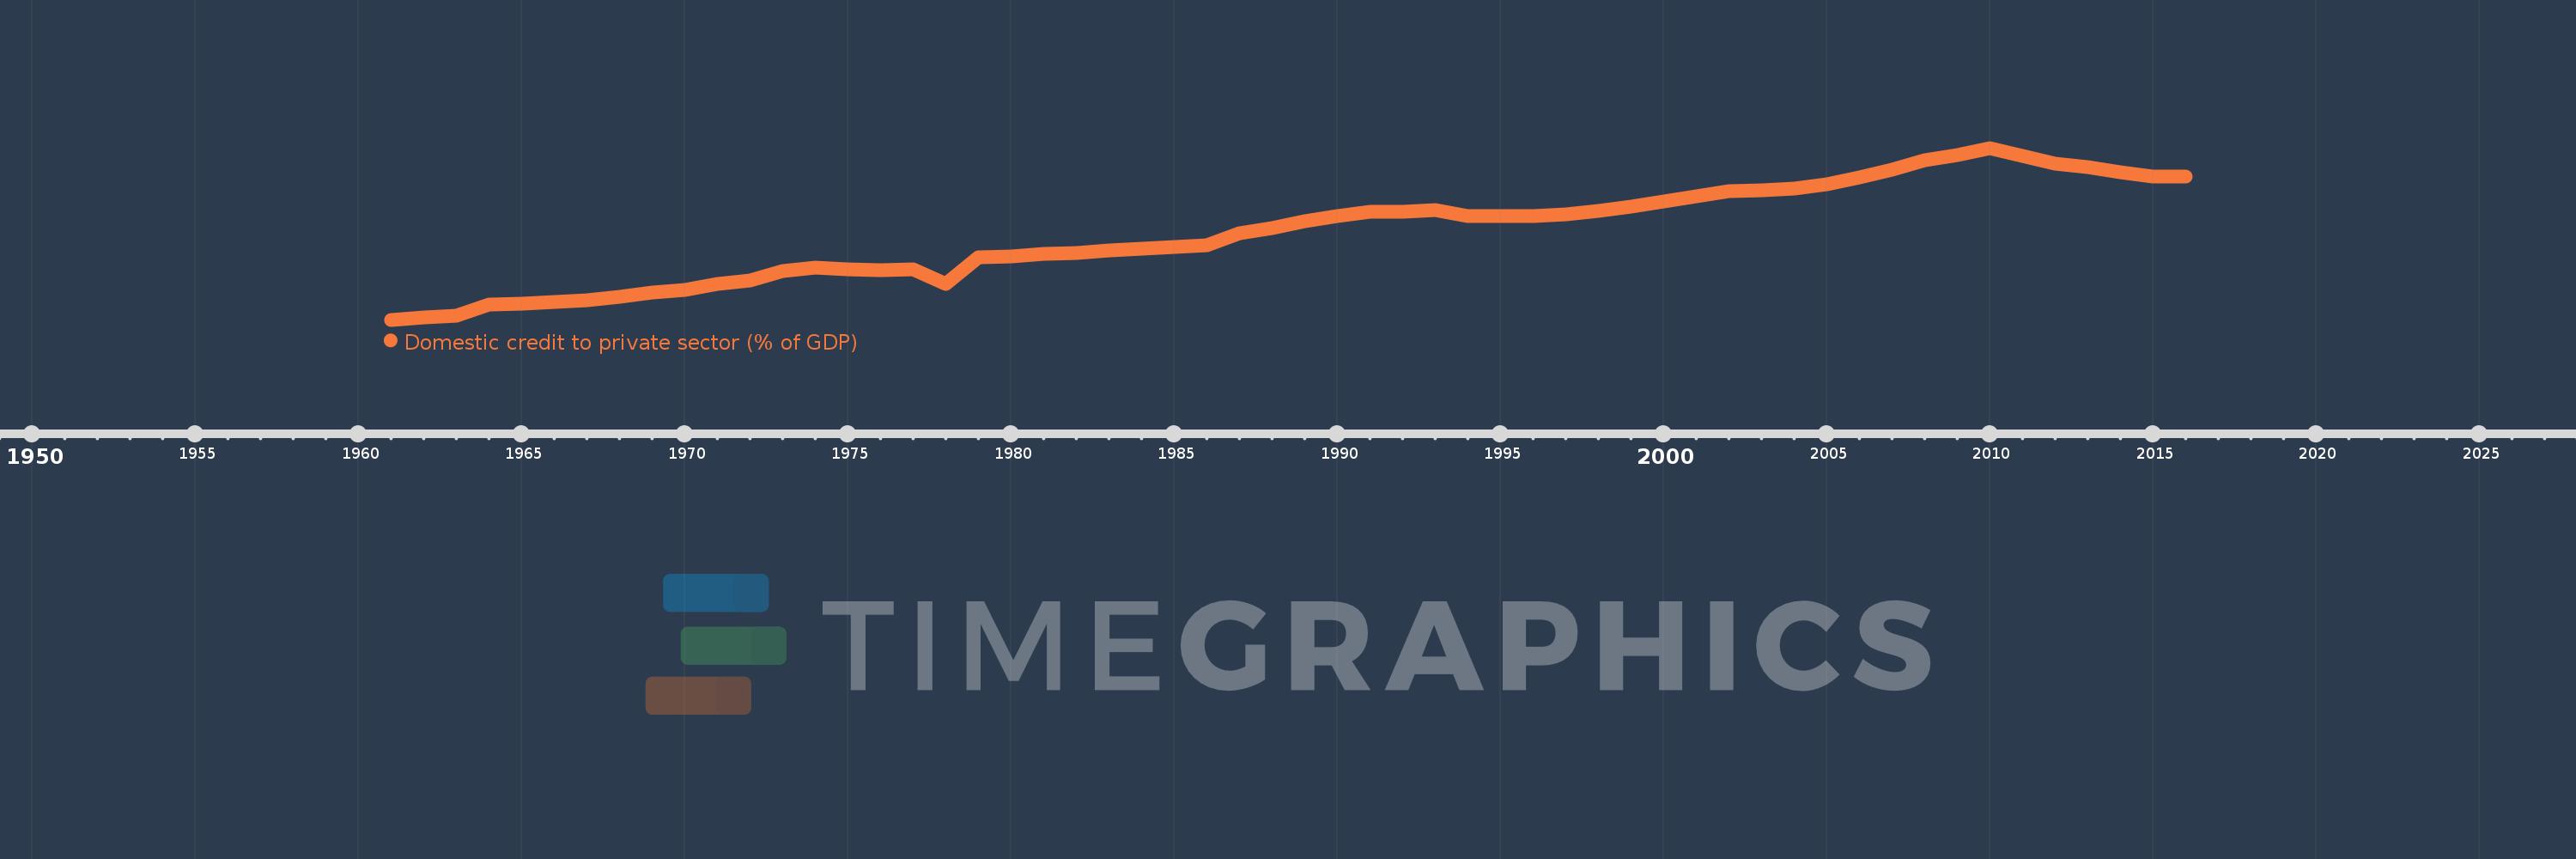
Domestic credit to private sector (% of GDP)
2016,2015,2014,2013,2012,2011,2010,2009,2008,2007,2006,2005,2004,2003,2002,1999,1998,1997,1996,1995,1994,1993,1992,1991,1990,1989,1988,1987,1986,1985,1984,1983,1982,1981,1980,1979,1978,1977,1976,1975,1974,1973,1972,1971,1970,1969,1968,1967,1966,1965,1964,1963,1962,1961
This statistics in other country:
AfghanistanAlbaniaAlgeriaAngolaAntigua and BarbudaArab WorldArgentinaArmeniaArubaAustraliaAustriaAzerbaijanBahamas, TheBahrainBangladeshBarbadosBelarusBelgiumBelizeBeninBhutanBoliviaBosnia and HerzegovinaBotswanaBrazilBrunei DarussalamBulgariaBurkina FasoBurundiCabo VerdeCambodiaCameroonCanadaCaribbean small statesCentral African RepublicCentral Europe and the BalticsChadChileChinaColombiaComorosCongo, Dem. Rep.Congo, Rep.Costa RicaCote d'IvoireCroatiaCyprusCzech RepublicDenmarkDjiboutiDominicaDominican RepublicEarly-demographic dividendEast Asia & PacificEast Asia & Pacific (excluding high income)East Asia & Pacific (IDA & IBRD countries)EcuadorEgypt, Arab Rep.El SalvadorEquatorial GuineaEritreaEstoniaEthiopiaEuro areaEurope & Central AsiaEurope & Central Asia (excluding high income)Europe & Central Asia (IDA & IBRD countries)European UnionFijiFinlandFragile and conflict affected situationsFranceGabonGambia, TheGeorgiaGermanyGhanaGreeceGrenadaGuatemalaGuineaGuinea-BissauGuyanaHaitiHeavily indebted poor countries (HIPC)High incomeHondurasHong Kong SAR, ChinaHungaryIBRD onlyIcelandIDA & IBRD totalIDA blendIDA onlyIDA totalIndiaIndonesiaIran, Islamic Rep.IraqIrelandIsraelItalyJamaicaJapanJordanKazakhstanKenyaKorea, Rep.KosovoKuwaitKyrgyz RepublicLao PDRLate-demographic dividendLatin America & Caribbean Latin America & Caribbean (excluding high income)Latin America & the Caribbean (IDA & IBRD countries)LatviaLeast developed countries: UN classificationLebanonLesothoLiberiaLibyaLithuaniaLow & middle incomeLow incomeLower middle incomeLuxembourgMacao SAR, ChinaMacedonia, FYRMadagascarMalawiMalaysiaMaldivesMaliMaltaMauritaniaMauritiusMexicoMicronesia, Fed. Sts.Middle East & North AfricaMiddle East & North Africa (excluding high income)Middle East & North Africa (IDA & IBRD countries)Middle incomeMoldovaMongoliaMontenegroMoroccoMozambiqueMyanmarNamibiaNepalNetherlandsNew ZealandNicaraguaNigerNigeriaNorth AmericaNorwayOECD membersOmanOther small statesPacific island small statesPakistanPanamaPapua New GuineaParaguayPeruPhilippinesPolandPortugalPost-demographic dividendPre-demographic dividendQatarRomaniaRussian FederationRwandaSamoaSao Tome and PrincipeSaudi ArabiaSenegalSerbiaSeychellesSierra LeoneSingaporeSlovak RepublicSloveniaSmall statesSolomon IslandsSouth AfricaSouth AsiaSouth Asia (IDA & IBRD)South SudanSpainSri LankaSt. Kitts and NevisSt. LuciaSt. Vincent and the GrenadinesSub-Saharan Africa Sub-Saharan Africa (excluding high income)Sub-Saharan Africa (IDA & IBRD countries)SudanSurinameSwazilandSwedenSwitzerlandSyrian Arab RepublicTajikistanTanzaniaThailandTimor-LesteTogoTongaTrinidad and TobagoTunisiaTurkeyUgandaUkraineUnited Arab EmiratesUnited KingdomUnited StatesUpper middle incomeUruguayVanuatuVenezuela, RBVietnamWest Bank and GazaWorldYemen, Rep.ZambiaZimbabwe Timeline:
This timeline shows a graph from 1961 to 2016 of Europe & Central Asia. No data until 1960. Number of actual observations by date: 54.
Source name:
World Development Indicators
Source organization:
International Monetary Fund, International Financial Statistics and data files, and World Bank and OECD GDP estimates.
Categories, topics:
Financial Sector, Private Sector
Last updated:
apr 23, 2017
Indicators value changes by year
Minimum:
25.048
jan 1, 1961
Maximum:
110.544
jan 1, 2010
At the date of observation
Value
Absolute change
Change from previous value
jan 1, 1961
25.048
+25.048
0.0%
jan 1, 1962
26.086
+1.038
4.14%
jan 1, 1963
27.198
+1.112
4.26%
jan 1, 1964
32.591
+5.393
19.83%
jan 1, 1965
32.954
+0.363
1.11%
jan 1, 1966
33.789
+0.835
2.53%
jan 1, 1967
34.698
+0.909
2.69%
jan 1, 1968
36.431
+1.732
4.99%
jan 1, 1969
38.803
+2.372
6.51%
jan 1, 1970
39.735
+0.932
2.4%
jan 1, 1971
42.835
+3.1
7.8%
jan 1, 1972
44.764
+1.929
4.5%
jan 1, 1973
49.232
+4.468
9.98%
jan 1, 1974
50.846
+1.614
3.28%
jan 1, 1975
50.3
-0.546
-1.07%
jan 1, 1976
49.818
-0.482
-0.96%
jan 1, 1977
50.054
+0.236
0.47%
jan 1, 1978
42.766
-7.288
-14.56%
jan 1, 1979
56.159
+13.393
31.32%
jan 1, 1980
56.425
+0.266
0.47%
jan 1, 1981
57.626
+1.202
2.13%
jan 1, 1982
58.305
+0.679
1.18%
jan 1, 1983
59.704
+1.399
2.4%
jan 1, 1984
60.448
+0.744
1.25%
jan 1, 1985
61.338
+0.89
1.47%
jan 1, 1986
61.91
+0.573
0.93%
jan 1, 1987
67.977
+6.066
9.8%
jan 1, 1988
70.467
+2.49
3.66%
jan 1, 1989
73.967
+3.5
4.97%
jan 1, 1990
76.802
+2.835
3.83%
jan 1, 1991
78.866
+2.064
2.69%
jan 1, 1992
78.958
+0.092
0.12%
jan 1, 1993
79.768
+0.81
1.03%
jan 1, 1994
76.551
-3.217
-4.03%
jan 1, 1995
76.684
+0.133
0.17%
jan 1, 1996
76.716
+0.032
0.04%
jan 1, 1997
77.617
+0.901
1.17%
jan 1, 1998
79.051
+1.434
1.85%
jan 1, 1999
81.19
+2.14
2.71%
jan 1, 2002
88.886
+7.695
9.48%
jan 1, 2003
89.269
+0.383
0.43%
jan 1, 2004
90.435
+1.166
1.31%
jan 1, 2005
92.28
+1.845
2.04%
jan 1, 2006
95.843
+3.563
3.86%
jan 1, 2007
99.85
+4.007
4.18%
jan 1, 2008
104.463
+4.613
4.62%
jan 1, 2009
107.05
+2.587
2.48%
jan 1, 2010
110.544
+3.494
3.26%
jan 1, 2011
106.691
-3.853
-3.49%
jan 1, 2012
102.908
-3.783
-3.55%
jan 1, 2013
100.92
-1.988
-1.93%
jan 1, 2014
98.606
-2.314
-2.29%
jan 1, 2015
96.201
-2.405
-2.44%
jan 1, 2016
96.239
+0.038
0.04%
Ranking of countries by current statistics by years


Comments: