29
/
en
AIzaSyAYiBZKx7MnpbEhh9jyipgxe19OcubqV5w
April 1, 2024
285756
Zambia
ZMB
true
2
1
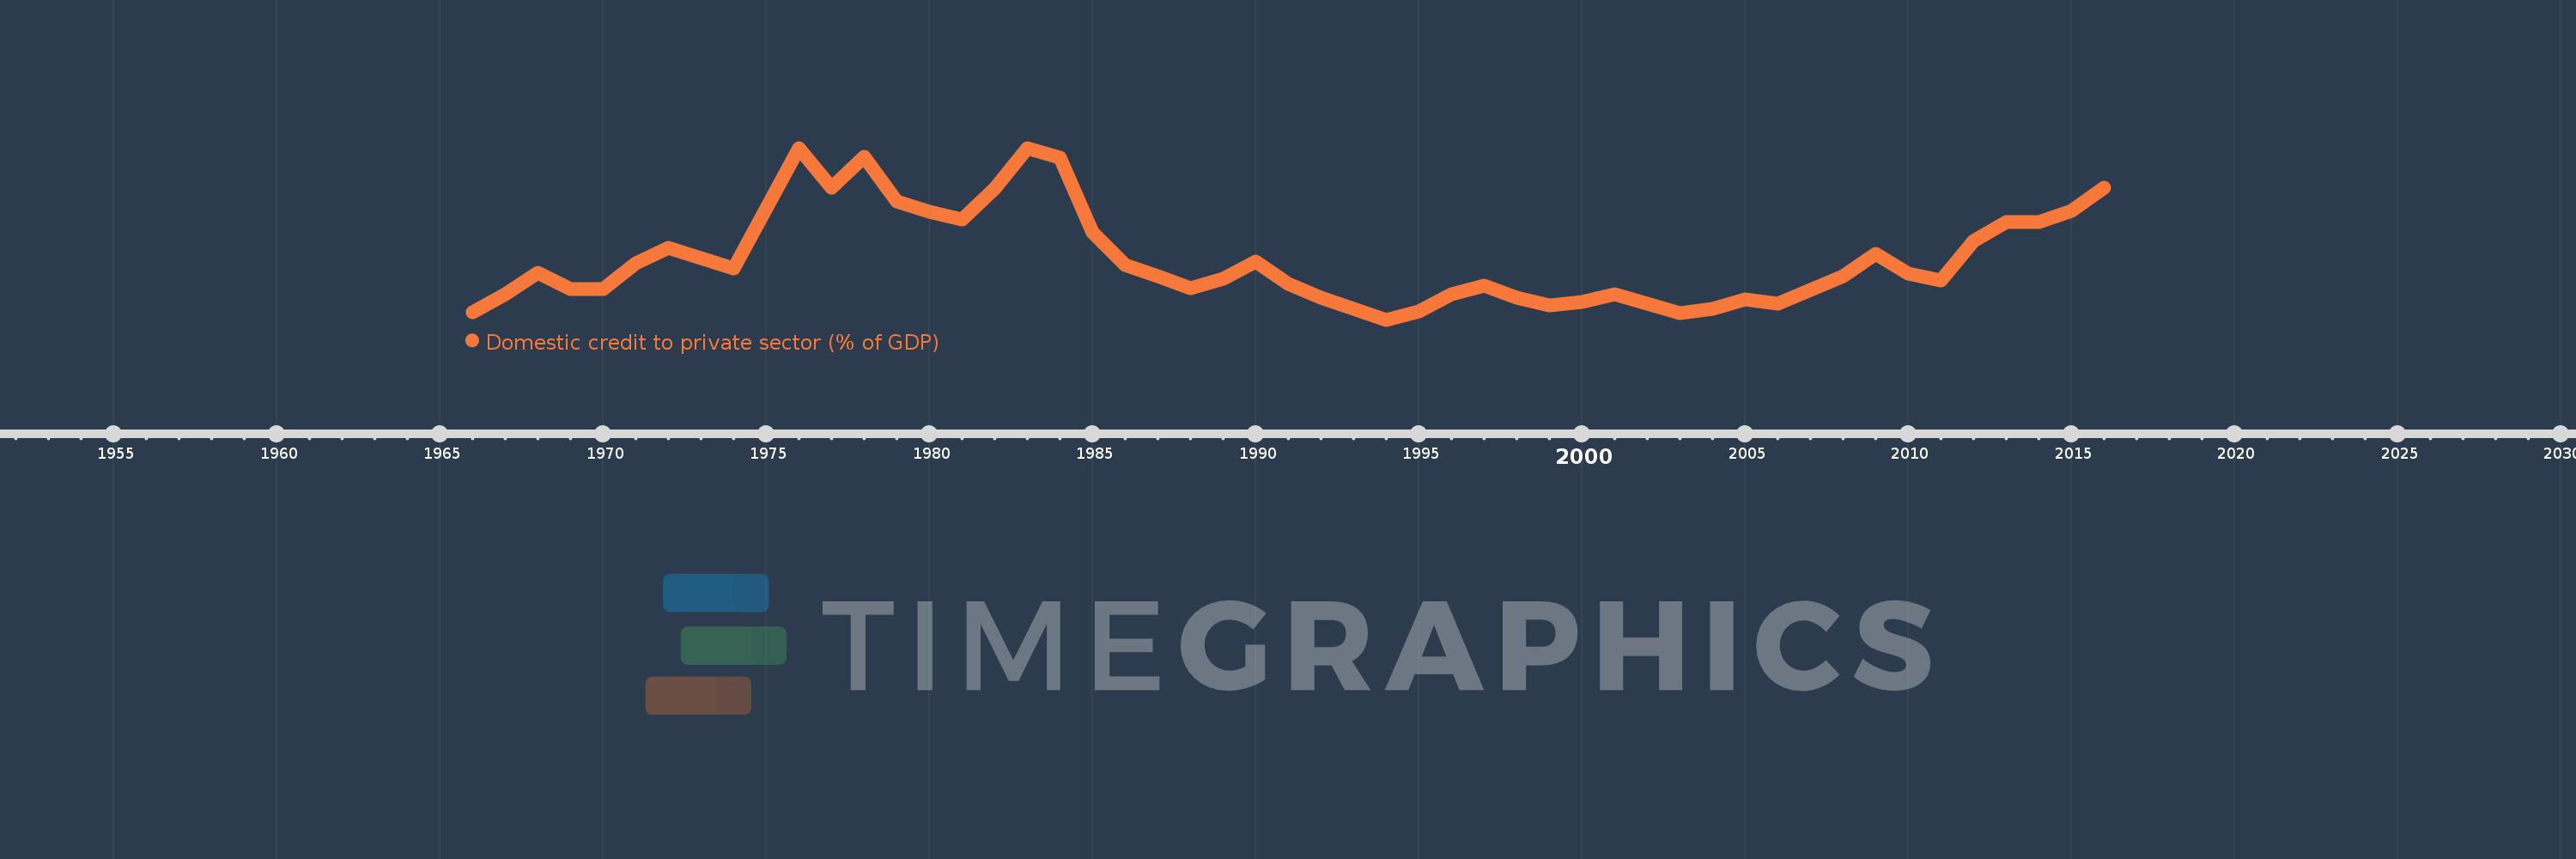
Domestic credit to private sector (% of GDP)
2016,2015,2014,2013,2012,2011,2010,2009,2008,2007,2006,2005,2004,2003,2002,2001,2000,1999,1998,1997,1996,1995,1994,1992,1991,1990,1989,1988,1987,1986,1985,1984,1983,1982,1981,1980,1979,1978,1977,1976,1975,1974,1973,1972,1971,1970,1969,1968,1967,1966
This statistics in other country:
AfghanistanAlbaniaAlgeriaAngolaAntigua and BarbudaArab WorldArgentinaArmeniaArubaAustraliaAustriaAzerbaijanBahamas, TheBahrainBangladeshBarbadosBelarusBelgiumBelizeBeninBhutanBoliviaBosnia and HerzegovinaBotswanaBrazilBrunei DarussalamBulgariaBurkina FasoBurundiCabo VerdeCambodiaCameroonCanadaCaribbean small statesCentral African RepublicCentral Europe and the BalticsChadChileChinaColombiaComorosCongo, Dem. Rep.Congo, Rep.Costa RicaCote d'IvoireCroatiaCyprusCzech RepublicDenmarkDjiboutiDominicaDominican RepublicEarly-demographic dividendEast Asia & PacificEast Asia & Pacific (excluding high income)East Asia & Pacific (IDA & IBRD countries)EcuadorEgypt, Arab Rep.El SalvadorEquatorial GuineaEritreaEstoniaEthiopiaEuro areaEurope & Central AsiaEurope & Central Asia (excluding high income)Europe & Central Asia (IDA & IBRD countries)European UnionFijiFinlandFragile and conflict affected situationsFranceGabonGambia, TheGeorgiaGermanyGhanaGreeceGrenadaGuatemalaGuineaGuinea-BissauGuyanaHaitiHeavily indebted poor countries (HIPC)High incomeHondurasHong Kong SAR, ChinaHungaryIBRD onlyIcelandIDA & IBRD totalIDA blendIDA onlyIDA totalIndiaIndonesiaIran, Islamic Rep.IraqIrelandIsraelItalyJamaicaJapanJordanKazakhstanKenyaKorea, Rep.KosovoKuwaitKyrgyz RepublicLao PDRLate-demographic dividendLatin America & Caribbean Latin America & Caribbean (excluding high income)Latin America & the Caribbean (IDA & IBRD countries)LatviaLeast developed countries: UN classificationLebanonLesothoLiberiaLibyaLithuaniaLow & middle incomeLow incomeLower middle incomeLuxembourgMacao SAR, ChinaMacedonia, FYRMadagascarMalawiMalaysiaMaldivesMaliMaltaMauritaniaMauritiusMexicoMicronesia, Fed. Sts.Middle East & North AfricaMiddle East & North Africa (excluding high income)Middle East & North Africa (IDA & IBRD countries)Middle incomeMoldovaMongoliaMontenegroMoroccoMozambiqueMyanmarNamibiaNepalNetherlandsNew ZealandNicaraguaNigerNigeriaNorth AmericaNorwayOECD membersOmanOther small statesPacific island small statesPakistanPanamaPapua New GuineaParaguayPeruPhilippinesPolandPortugalPost-demographic dividendPre-demographic dividendQatarRomaniaRussian FederationRwandaSamoaSao Tome and PrincipeSaudi ArabiaSenegalSerbiaSeychellesSierra LeoneSingaporeSlovak RepublicSloveniaSmall statesSolomon IslandsSouth AfricaSouth AsiaSouth Asia (IDA & IBRD)South SudanSpainSri LankaSt. Kitts and NevisSt. LuciaSt. Vincent and the GrenadinesSub-Saharan Africa Sub-Saharan Africa (excluding high income)Sub-Saharan Africa (IDA & IBRD countries)SudanSurinameSwazilandSwedenSwitzerlandSyrian Arab RepublicTajikistanTanzaniaThailandTimor-LesteTogoTongaTrinidad and TobagoTunisiaTurkeyUgandaUkraineUnited Arab EmiratesUnited KingdomUnited StatesUpper middle incomeUruguayVanuatuVenezuela, RBVietnamWest Bank and GazaWorldYemen, Rep.ZambiaZimbabwe Timeline:
This timeline shows a graph from 1966 to 2016 of Zambia. No data until 1965. Number of actual observations by date: 50.
Source name:
World Development Indicators
Source organization:
International Monetary Fund, International Financial Statistics and data files, and World Bank and OECD GDP estimates.
Categories, topics:
Financial Sector, Private Sector
Last updated:
apr 23, 2017
Indicators value changes by year
Maximum:
24.234
jan 1, 1976
At the date of observation
Value
Absolute change
Change from previous value
jan 1, 1966
5.631
+5.631
0.0%
jan 1, 1967
7.655
+2.025
35.96%
jan 1, 1968
10.112
+2.456
32.09%
jan 1, 1969
8.233
-1.878
-18.58%
jan 1, 1970
8.303
+0.07
0.85%
jan 1, 1971
11.186
+2.883
34.72%
jan 1, 1972
12.893
+1.707
15.26%
jan 1, 1973
11.741
-1.152
-8.94%
jan 1, 1974
10.56
-1.181
-10.06%
jan 1, 1975
17.412
+6.853
64.89%
jan 1, 1976
24.234
+6.821
39.18%
jan 1, 1977
19.702
-4.532
-18.7%
jan 1, 1978
23.228
+3.526
17.9%
jan 1, 1979
18.2
-5.029
-21.65%
jan 1, 1980
16.971
-1.229
-6.75%
jan 1, 1981
16.168
-0.803
-4.73%
jan 1, 1982
19.657
+3.489
21.58%
jan 1, 1983
24.18
+4.523
23.01%
jan 1, 1984
23.149
-1.031
-4.27%
jan 1, 1985
14.641
-8.508
-36.75%
jan 1, 1986
10.936
-3.705
-25.3%
jan 1, 1987
9.702
-1.235
-11.29%
jan 1, 1988
8.391
-1.311
-13.51%
jan 1, 1989
9.459
+1.068
12.73%
jan 1, 1990
11.333
+1.874
19.81%
jan 1, 1991
8.876
-2.458
-21.69%
jan 1, 1992
7.258
-1.618
-18.23%
jan 1, 1994
4.789
-2.468
-34.01%
jan 1, 1995
5.736
+0.946
19.76%
jan 1, 1996
7.72
+1.985
34.6%
jan 1, 1997
8.604
+0.884
11.45%
jan 1, 1998
7.268
-1.336
-15.52%
jan 1, 1999
6.429
-0.84
-11.55%
jan 1, 2000
6.808
+0.38
5.91%
jan 1, 2001
7.689
+0.881
12.94%
jan 1, 2002
6.648
-1.041
-13.54%
jan 1, 2003
5.574
-1.074
-16.15%
jan 1, 2004
6.001
+0.426
7.65%
jan 1, 2005
7.046
+1.046
17.42%
jan 1, 2006
6.632
-0.414
-5.88%
jan 1, 2007
8.17
+1.538
23.19%
jan 1, 2008
9.705
+1.535
18.79%
jan 1, 2009
12.236
+2.532
26.09%
jan 1, 2010
10.009
-2.228
-18.21%
jan 1, 2011
9.198
-0.811
-8.1%
jan 1, 2012
13.693
+4.495
48.87%
jan 1, 2013
15.859
+2.166
15.82%
jan 1, 2014
15.817
-0.042
-0.26%
jan 1, 2015
17.088
+1.271
8.04%
jan 1, 2016
19.765
+2.677
15.66%
Ranking of countries by current statistics by years


Comments: