29
/
en
AIzaSyAYiBZKx7MnpbEhh9jyipgxe19OcubqV5w
April 1, 2024
116750
Cyprus
CYP
true
2
1
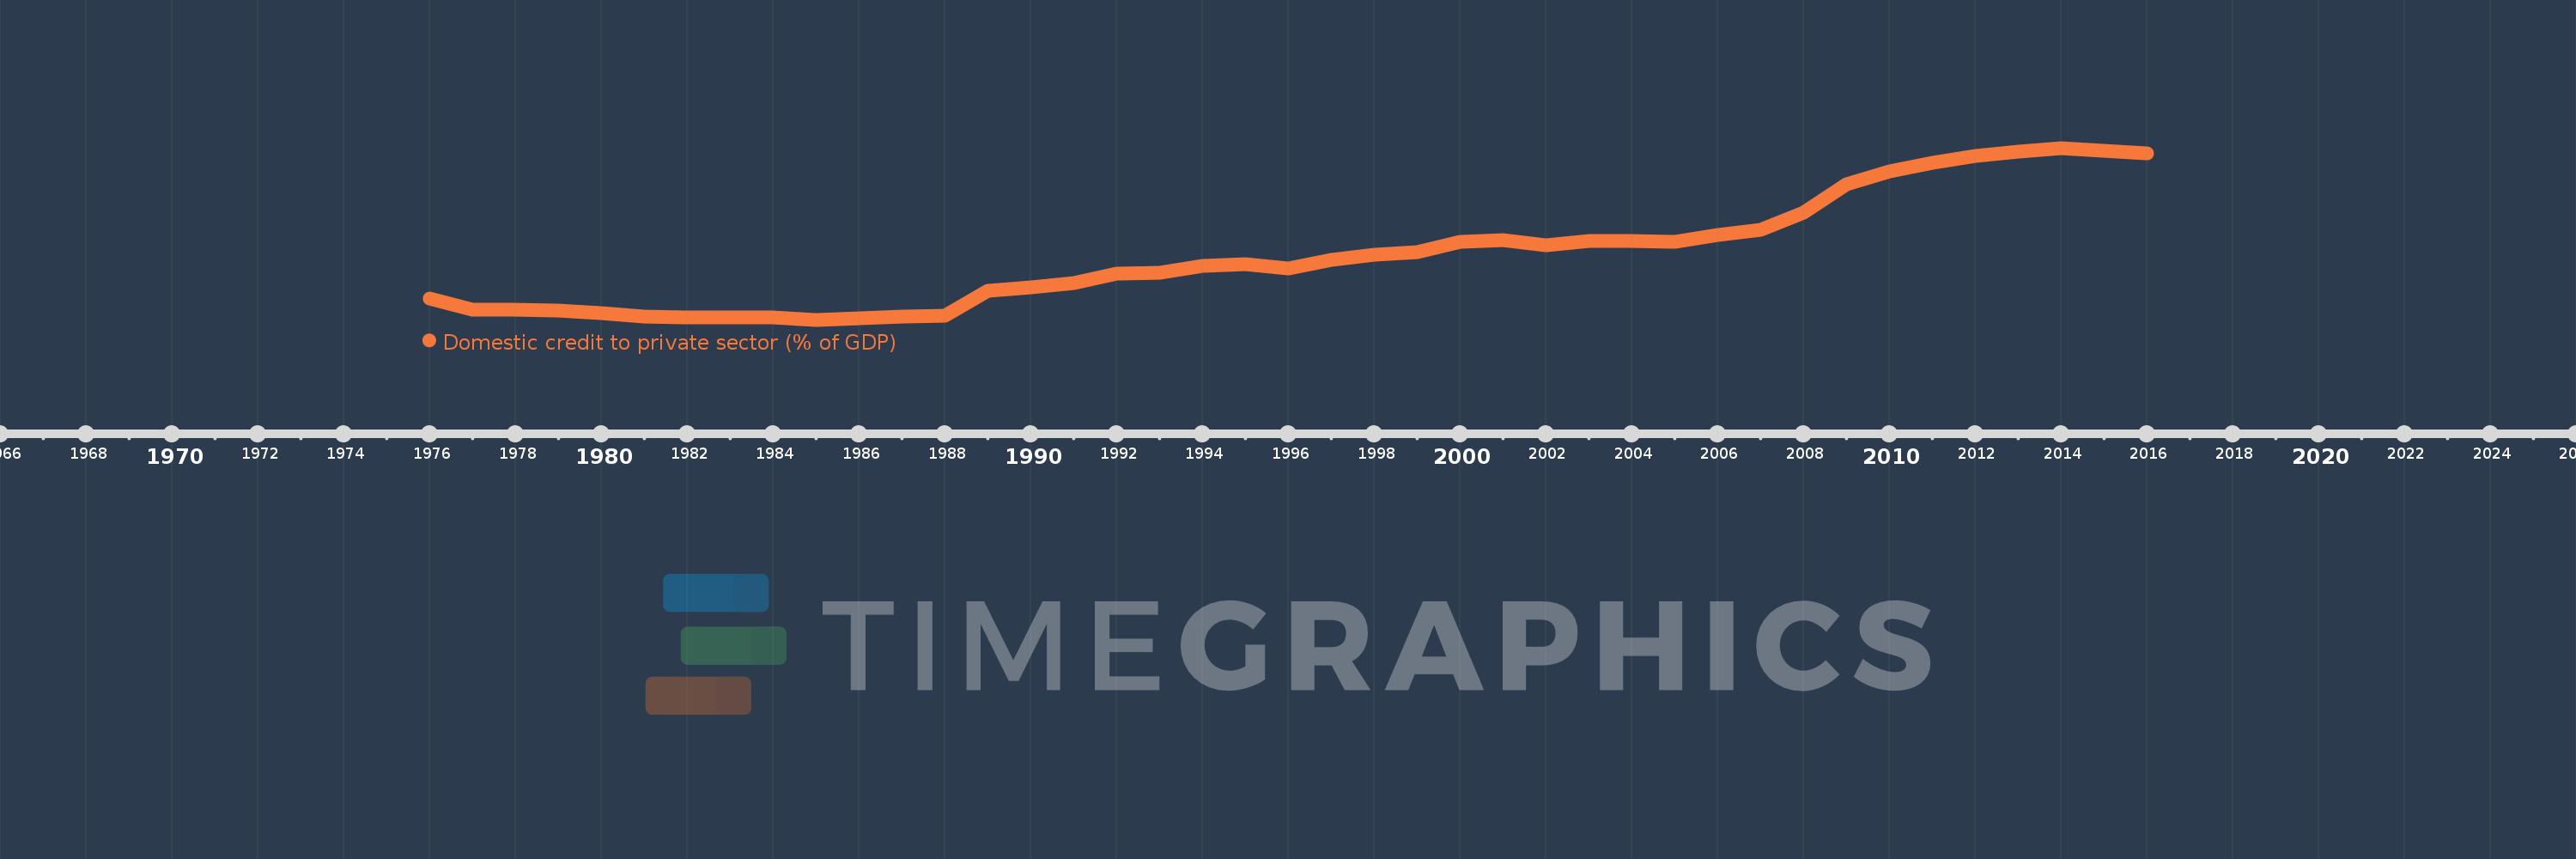
Domestic credit to private sector (% of GDP)
2016,2015,2014,2013,2012,2011,2010,2009,2008,2007,2006,2005,2004,2003,2002,2001,2000,1999,1998,1997,1996,1995,1994,1993,1992,1991,1990,1989,1988,1987,1986,1985,1984,1983,1982,1981,1980,1979,1978,1977,1976
This statistics in other country:
AfghanistanAlbaniaAlgeriaAngolaAntigua and BarbudaArab WorldArgentinaArmeniaArubaAustraliaAustriaAzerbaijanBahamas, TheBahrainBangladeshBarbadosBelarusBelgiumBelizeBeninBhutanBoliviaBosnia and HerzegovinaBotswanaBrazilBrunei DarussalamBulgariaBurkina FasoBurundiCabo VerdeCambodiaCameroonCanadaCaribbean small statesCentral African RepublicCentral Europe and the BalticsChadChileChinaColombiaComorosCongo, Dem. Rep.Congo, Rep.Costa RicaCote d'IvoireCroatiaCyprusCzech RepublicDenmarkDjiboutiDominicaDominican RepublicEarly-demographic dividendEast Asia & PacificEast Asia & Pacific (excluding high income)East Asia & Pacific (IDA & IBRD countries)EcuadorEgypt, Arab Rep.El SalvadorEquatorial GuineaEritreaEstoniaEthiopiaEuro areaEurope & Central AsiaEurope & Central Asia (excluding high income)Europe & Central Asia (IDA & IBRD countries)European UnionFijiFinlandFragile and conflict affected situationsFranceGabonGambia, TheGeorgiaGermanyGhanaGreeceGrenadaGuatemalaGuineaGuinea-BissauGuyanaHaitiHeavily indebted poor countries (HIPC)High incomeHondurasHong Kong SAR, ChinaHungaryIBRD onlyIcelandIDA & IBRD totalIDA blendIDA onlyIDA totalIndiaIndonesiaIran, Islamic Rep.IraqIrelandIsraelItalyJamaicaJapanJordanKazakhstanKenyaKorea, Rep.KosovoKuwaitKyrgyz RepublicLao PDRLate-demographic dividendLatin America & Caribbean Latin America & Caribbean (excluding high income)Latin America & the Caribbean (IDA & IBRD countries)LatviaLeast developed countries: UN classificationLebanonLesothoLiberiaLibyaLithuaniaLow & middle incomeLow incomeLower middle incomeLuxembourgMacao SAR, ChinaMacedonia, FYRMadagascarMalawiMalaysiaMaldivesMaliMaltaMauritaniaMauritiusMexicoMicronesia, Fed. Sts.Middle East & North AfricaMiddle East & North Africa (excluding high income)Middle East & North Africa (IDA & IBRD countries)Middle incomeMoldovaMongoliaMontenegroMoroccoMozambiqueMyanmarNamibiaNepalNetherlandsNew ZealandNicaraguaNigerNigeriaNorth AmericaNorwayOECD membersOmanOther small statesPacific island small statesPakistanPanamaPapua New GuineaParaguayPeruPhilippinesPolandPortugalPost-demographic dividendPre-demographic dividendQatarRomaniaRussian FederationRwandaSamoaSao Tome and PrincipeSaudi ArabiaSenegalSerbiaSeychellesSierra LeoneSingaporeSlovak RepublicSloveniaSmall statesSolomon IslandsSouth AfricaSouth AsiaSouth Asia (IDA & IBRD)South SudanSpainSri LankaSt. Kitts and NevisSt. LuciaSt. Vincent and the GrenadinesSub-Saharan Africa Sub-Saharan Africa (excluding high income)Sub-Saharan Africa (IDA & IBRD countries)SudanSurinameSwazilandSwedenSwitzerlandSyrian Arab RepublicTajikistanTanzaniaThailandTimor-LesteTogoTongaTrinidad and TobagoTunisiaTurkeyUgandaUkraineUnited Arab EmiratesUnited KingdomUnited StatesUpper middle incomeUruguayVanuatuVenezuela, RBVietnamWest Bank and GazaWorldYemen, Rep.ZambiaZimbabwe Timeline:
This timeline shows a graph from 1976 to 2016 of Cyprus. No data until 1975. Number of actual observations by date: 41.
Source name:
World Development Indicators
Source organization:
International Monetary Fund, International Financial Statistics and data files, and World Bank and OECD GDP estimates.
Categories, topics:
Financial Sector, Private Sector
Last updated:
apr 23, 2017
Indicators value changes by year
Minimum:
57.377
jan 1, 1985
Maximum:
253.574
jan 1, 2014
At the date of observation
Value
Absolute change
Change from previous value
jan 1, 1976
81.451
+81.451
0.0%
jan 1, 1977
68.624
-12.827
-15.75%
jan 1, 1978
68.768
+0.145
0.21%
jan 1, 1979
67.736
-1.032
-1.5%
jan 1, 1980
65.261
-2.475
-3.65%
jan 1, 1981
61.483
-3.777
-5.79%
jan 1, 1982
60.393
-1.09
-1.77%
jan 1, 1983
59.854
-0.539
-0.89%
jan 1, 1984
59.855
+0.0
0.0%
jan 1, 1985
57.377
-2.478
-4.14%
jan 1, 1986
59.477
+2.1
3.66%
jan 1, 1987
61.274
+1.798
3.02%
jan 1, 1988
61.573
+0.299
0.49%
jan 1, 1989
90.007
+28.434
46.18%
jan 1, 1990
94.361
+4.353
4.84%
jan 1, 1991
99.664
+5.303
5.62%
jan 1, 1992
109.831
+10.167
10.2%
jan 1, 1993
110.88
+1.049
0.96%
jan 1, 1994
118.939
+8.059
7.27%
jan 1, 1995
121.21
+2.27
1.91%
jan 1, 1996
115.455
-5.755
-4.75%
jan 1, 1997
125.991
+10.536
9.13%
jan 1, 1998
131.271
+5.28
4.19%
jan 1, 1999
134.485
+3.214
2.45%
jan 1, 2000
146.705
+12.22
9.09%
jan 1, 2001
148.389
+1.684
1.15%
jan 1, 2002
142.104
-6.285
-4.24%
jan 1, 2003
146.945
+4.841
3.41%
jan 1, 2004
146.897
-0.048
-0.03%
jan 1, 2005
146.477
-0.419
-0.29%
jan 1, 2006
154.416
+7.939
5.42%
jan 1, 2007
160.295
+5.878
3.81%
jan 1, 2008
179.865
+19.57
12.21%
jan 1, 2009
212.249
+32.384
18.0%
jan 1, 2010
226.38
+14.131
6.66%
jan 1, 2011
236.213
+9.834
4.34%
jan 1, 2012
244.102
+7.889
3.34%
jan 1, 2013
249.581
+5.479
2.24%
jan 1, 2014
253.574
+3.992
1.6%
jan 1, 2015
250.618
-2.956
-1.17%
jan 1, 2016
247.636
-2.982
-1.19%
Ranking of countries by current statistics by years


Comments: