29
/
en
AIzaSyAYiBZKx7MnpbEhh9jyipgxe19OcubqV5w
April 1, 2024
62505
World
WLD
false
2
1
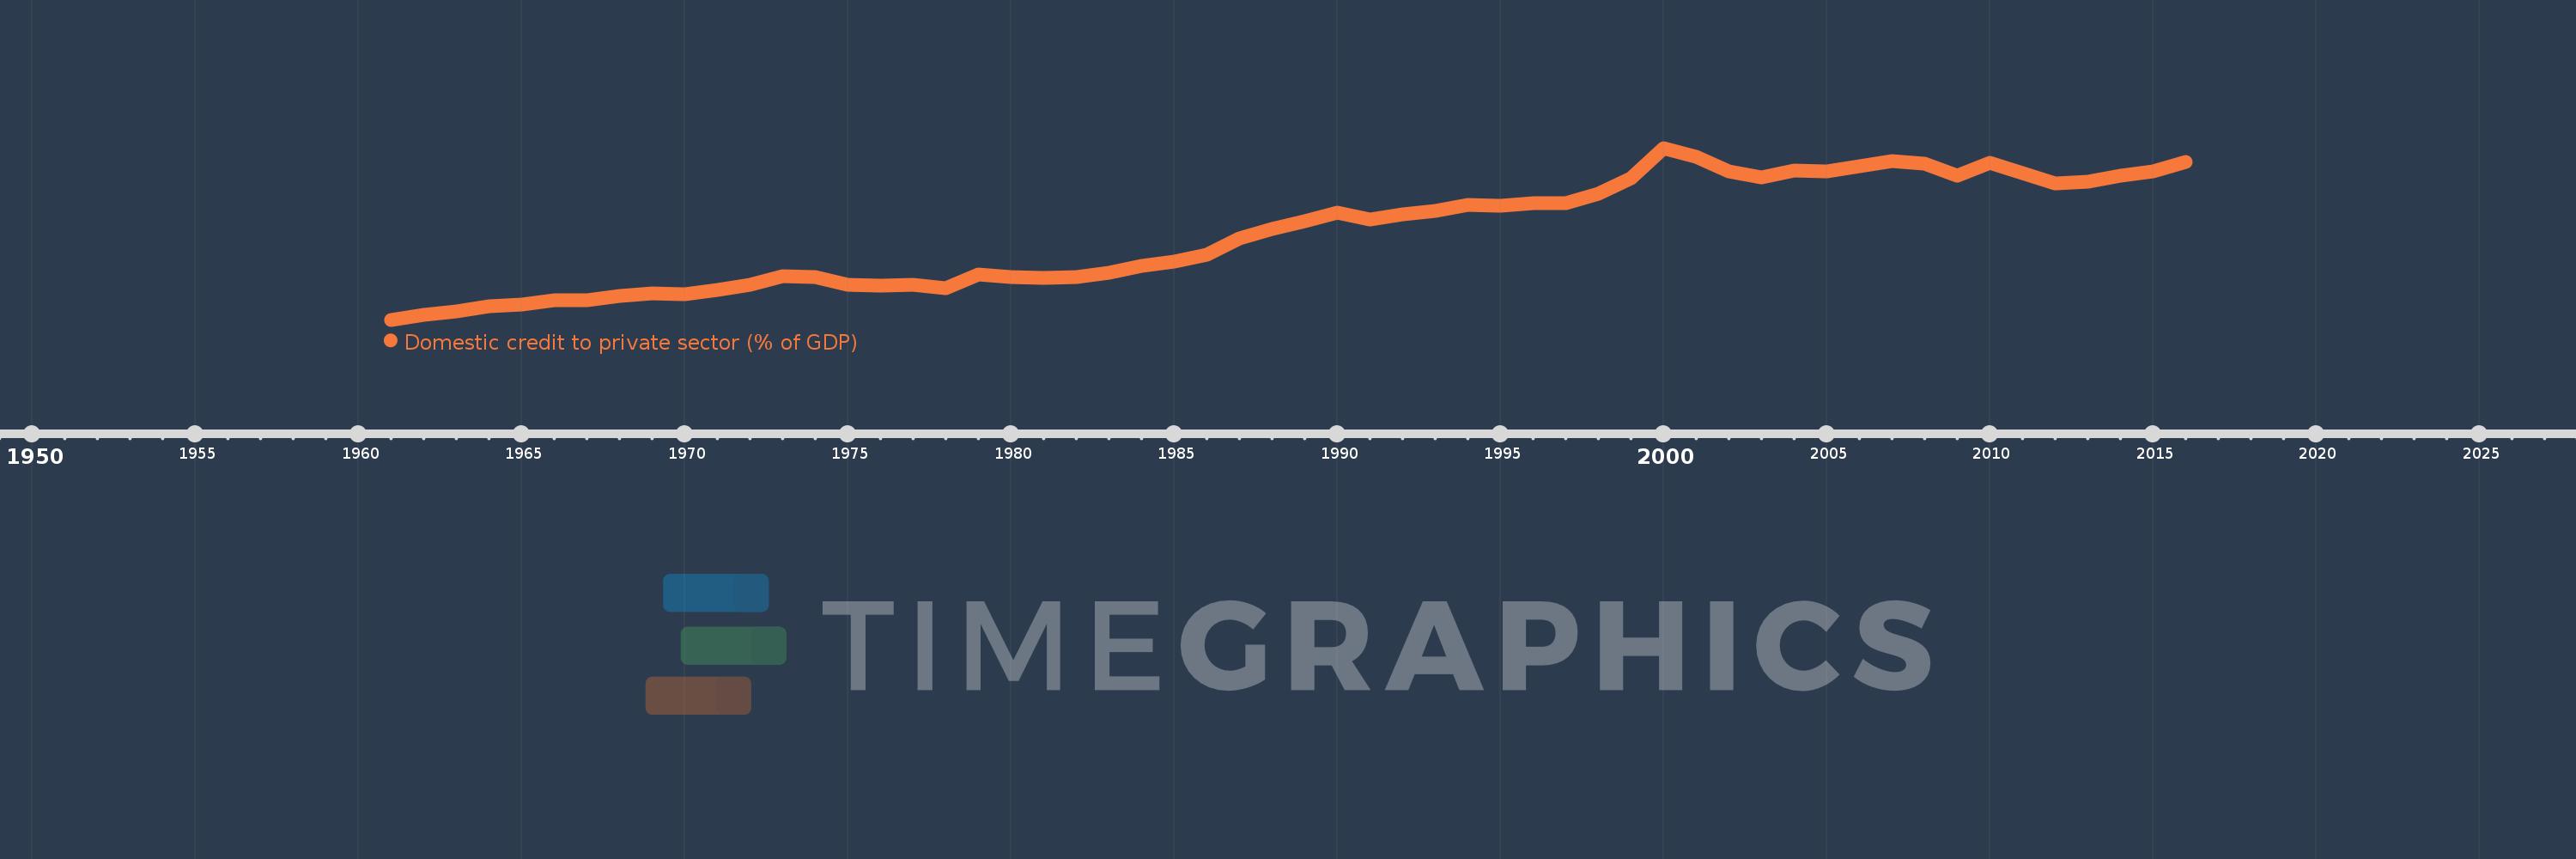
Domestic credit to private sector (% of GDP)
2016,2015,2014,2013,2012,2011,2010,2009,2008,2007,2006,2005,2004,2003,2002,2001,2000,1999,1998,1997,1996,1995,1994,1993,1992,1991,1990,1989,1988,1987,1986,1985,1984,1983,1982,1981,1980,1979,1978,1977,1976,1975,1974,1973,1972,1971,1970,1969,1968,1967,1966,1965,1964,1963,1962,1961
This statistics in other country:
AfghanistanAlbaniaAlgeriaAngolaAntigua and BarbudaArab WorldArgentinaArmeniaArubaAustraliaAustriaAzerbaijanBahamas, TheBahrainBangladeshBarbadosBelarusBelgiumBelizeBeninBhutanBoliviaBosnia and HerzegovinaBotswanaBrazilBrunei DarussalamBulgariaBurkina FasoBurundiCabo VerdeCambodiaCameroonCanadaCaribbean small statesCentral African RepublicCentral Europe and the BalticsChadChileChinaColombiaComorosCongo, Dem. Rep.Congo, Rep.Costa RicaCote d'IvoireCroatiaCyprusCzech RepublicDenmarkDjiboutiDominicaDominican RepublicEarly-demographic dividendEast Asia & PacificEast Asia & Pacific (excluding high income)East Asia & Pacific (IDA & IBRD countries)EcuadorEgypt, Arab Rep.El SalvadorEquatorial GuineaEritreaEstoniaEthiopiaEuro areaEurope & Central AsiaEurope & Central Asia (excluding high income)Europe & Central Asia (IDA & IBRD countries)European UnionFijiFinlandFragile and conflict affected situationsFranceGabonGambia, TheGeorgiaGermanyGhanaGreeceGrenadaGuatemalaGuineaGuinea-BissauGuyanaHaitiHeavily indebted poor countries (HIPC)High incomeHondurasHong Kong SAR, ChinaHungaryIBRD onlyIcelandIDA & IBRD totalIDA blendIDA onlyIDA totalIndiaIndonesiaIran, Islamic Rep.IraqIrelandIsraelItalyJamaicaJapanJordanKazakhstanKenyaKorea, Rep.KosovoKuwaitKyrgyz RepublicLao PDRLate-demographic dividendLatin America & Caribbean Latin America & Caribbean (excluding high income)Latin America & the Caribbean (IDA & IBRD countries)LatviaLeast developed countries: UN classificationLebanonLesothoLiberiaLibyaLithuaniaLow & middle incomeLow incomeLower middle incomeLuxembourgMacao SAR, ChinaMacedonia, FYRMadagascarMalawiMalaysiaMaldivesMaliMaltaMauritaniaMauritiusMexicoMicronesia, Fed. Sts.Middle East & North AfricaMiddle East & North Africa (excluding high income)Middle East & North Africa (IDA & IBRD countries)Middle incomeMoldovaMongoliaMontenegroMoroccoMozambiqueMyanmarNamibiaNepalNetherlandsNew ZealandNicaraguaNigerNigeriaNorth AmericaNorwayOECD membersOmanOther small statesPacific island small statesPakistanPanamaPapua New GuineaParaguayPeruPhilippinesPolandPortugalPost-demographic dividendPre-demographic dividendQatarRomaniaRussian FederationRwandaSamoaSao Tome and PrincipeSaudi ArabiaSenegalSerbiaSeychellesSierra LeoneSingaporeSlovak RepublicSloveniaSmall statesSolomon IslandsSouth AfricaSouth AsiaSouth Asia (IDA & IBRD)South SudanSpainSri LankaSt. Kitts and NevisSt. LuciaSt. Vincent and the GrenadinesSub-Saharan Africa Sub-Saharan Africa (excluding high income)Sub-Saharan Africa (IDA & IBRD countries)SudanSurinameSwazilandSwedenSwitzerlandSyrian Arab RepublicTajikistanTanzaniaThailandTimor-LesteTogoTongaTrinidad and TobagoTunisiaTurkeyUgandaUkraineUnited Arab EmiratesUnited KingdomUnited StatesUpper middle incomeUruguayVanuatuVenezuela, RBVietnamWest Bank and GazaWorldYemen, Rep.ZambiaZimbabwe Timeline:
This timeline shows a graph from 1961 to 2016 of World. No data until 1960. Number of actual observations by date: 56.
Source name:
World Development Indicators
Source organization:
International Monetary Fund, International Financial Statistics and data files, and World Bank and OECD GDP estimates.
Categories, topics:
Financial Sector, Private Sector
Last updated:
apr 23, 2017
Indicators value changes by year
Minimum:
48.971
jan 1, 1961
Maximum:
135.861
jan 1, 2000
At the date of observation
Value
Absolute change
Change from previous value
jan 1, 1961
48.971
+48.971
0.0%
jan 1, 1962
51.419
+2.448
5.0%
jan 1, 1963
52.988
+1.57
3.05%
jan 1, 1964
55.797
+2.808
5.3%
jan 1, 1965
56.782
+0.986
1.77%
jan 1, 1966
58.695
+1.913
3.37%
jan 1, 1967
58.699
+0.004
0.01%
jan 1, 1968
60.945
+2.246
3.83%
jan 1, 1969
62.313
+1.368
2.24%
jan 1, 1970
62.067
-0.245
-0.39%
jan 1, 1971
63.945
+1.877
3.02%
jan 1, 1972
66.565
+2.62
4.1%
jan 1, 1973
70.992
+4.427
6.65%
jan 1, 1974
70.489
-0.503
-0.71%
jan 1, 1975
66.691
-3.798
-5.39%
jan 1, 1976
66.176
-0.515
-0.77%
jan 1, 1977
66.751
+0.574
0.87%
jan 1, 1978
64.726
-2.024
-3.03%
jan 1, 1979
72.031
+7.304
11.29%
jan 1, 1980
70.731
-1.299
-1.8%
jan 1, 1981
69.928
-0.803
-1.14%
jan 1, 1982
70.728
+0.8
1.14%
jan 1, 1983
72.895
+2.167
3.06%
jan 1, 1984
76.231
+3.336
4.58%
jan 1, 1985
78.396
+2.165
2.84%
jan 1, 1986
82.064
+3.668
4.68%
jan 1, 1987
90.191
+8.127
9.9%
jan 1, 1988
94.797
+4.606
5.11%
jan 1, 1989
98.898
+4.102
4.33%
jan 1, 1990
103.287
+4.388
4.44%
jan 1, 1991
99.652
-3.634
-3.52%
jan 1, 1992
102.205
+2.553
2.56%
jan 1, 1993
104.199
+1.993
1.95%
jan 1, 1994
107.048
+2.85
2.73%
jan 1, 1995
106.647
-0.401
-0.37%
jan 1, 1996
107.823
+1.176
1.1%
jan 1, 1997
107.838
+0.015
0.01%
jan 1, 1998
112.627
+4.789
4.44%
jan 1, 1999
120.622
+7.995
7.1%
jan 1, 2000
135.861
+15.239
12.63%
jan 1, 2001
131.41
-4.452
-3.28%
jan 1, 2002
124.052
-7.358
-5.6%
jan 1, 2003
120.923
-3.129
-2.52%
jan 1, 2004
124.291
+3.367
2.78%
jan 1, 2005
124.171
-0.12
-0.1%
jan 1, 2006
126.735
+2.564
2.06%
jan 1, 2007
129.127
+2.392
1.89%
jan 1, 2008
127.794
-1.333
-1.03%
jan 1, 2009
121.902
-5.892
-4.61%
jan 1, 2010
128.25
+6.349
5.21%
jan 1, 2011
123.032
-5.218
-4.07%
jan 1, 2012
117.859
-5.173
-4.2%
jan 1, 2013
118.953
+1.094
0.93%
jan 1, 2014
122.016
+3.063
2.58%
jan 1, 2015
123.895
+1.879
1.54%
jan 1, 2016
128.845
+4.95
4.0%
Ranking of countries by current statistics by years


Comments: