29
/
en
AIzaSyAYiBZKx7MnpbEhh9jyipgxe19OcubqV5w
April 1, 2024
90994
Brazil
BRA
true
2
1
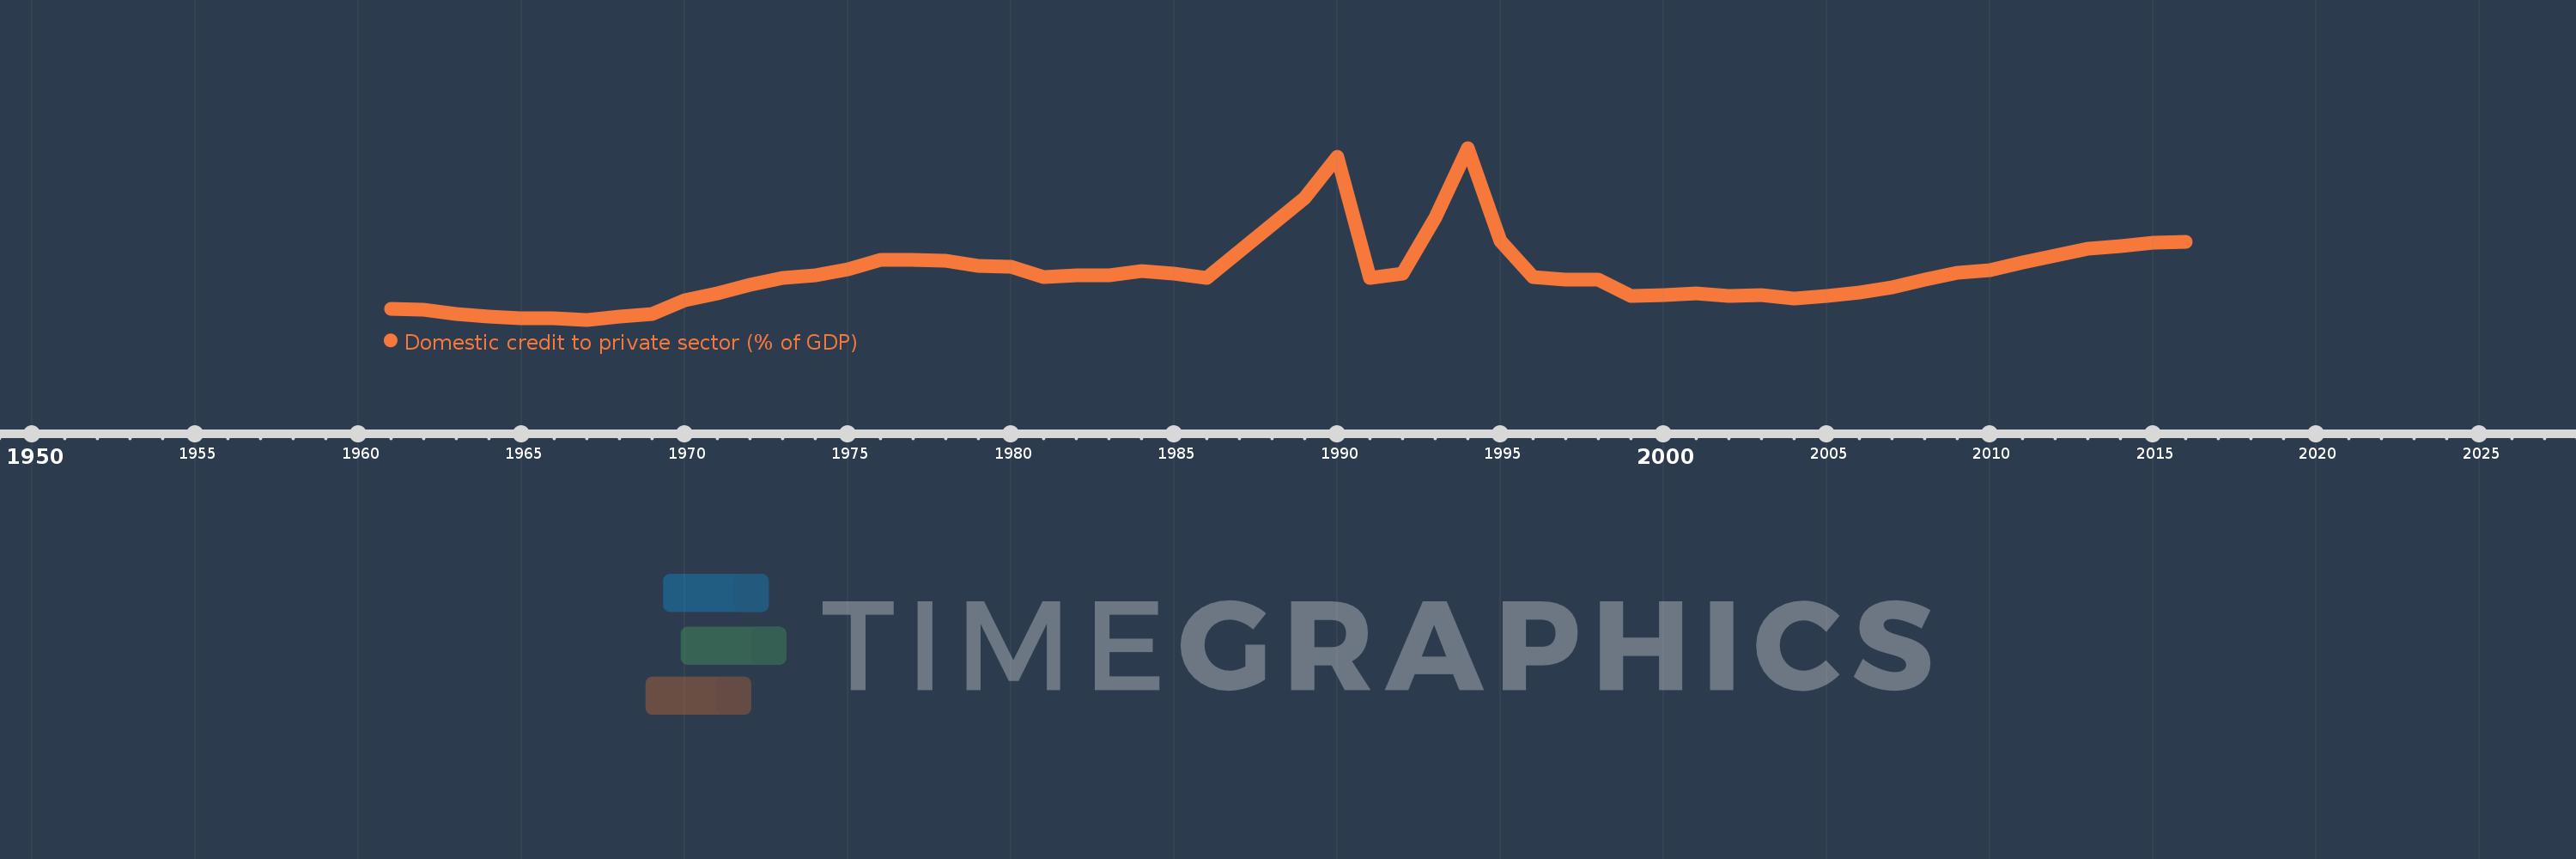
Domestic credit to private sector (% of GDP)
2016,2015,2014,2013,2012,2011,2010,2009,2008,2007,2006,2005,2004,2003,2002,2001,2000,1999,1998,1997,1996,1995,1994,1993,1992,1991,1990,1989,1986,1985,1984,1983,1982,1981,1980,1979,1978,1977,1976,1975,1974,1973,1972,1971,1970,1969,1968,1967,1966,1965,1964,1963,1962,1961
This statistics in other country:
AfghanistanAlbaniaAlgeriaAngolaAntigua and BarbudaArab WorldArgentinaArmeniaArubaAustraliaAustriaAzerbaijanBahamas, TheBahrainBangladeshBarbadosBelarusBelgiumBelizeBeninBhutanBoliviaBosnia and HerzegovinaBotswanaBrazilBrunei DarussalamBulgariaBurkina FasoBurundiCabo VerdeCambodiaCameroonCanadaCaribbean small statesCentral African RepublicCentral Europe and the BalticsChadChileChinaColombiaComorosCongo, Dem. Rep.Congo, Rep.Costa RicaCote d'IvoireCroatiaCyprusCzech RepublicDenmarkDjiboutiDominicaDominican RepublicEarly-demographic dividendEast Asia & PacificEast Asia & Pacific (excluding high income)East Asia & Pacific (IDA & IBRD countries)EcuadorEgypt, Arab Rep.El SalvadorEquatorial GuineaEritreaEstoniaEthiopiaEuro areaEurope & Central AsiaEurope & Central Asia (excluding high income)Europe & Central Asia (IDA & IBRD countries)European UnionFijiFinlandFragile and conflict affected situationsFranceGabonGambia, TheGeorgiaGermanyGhanaGreeceGrenadaGuatemalaGuineaGuinea-BissauGuyanaHaitiHeavily indebted poor countries (HIPC)High incomeHondurasHong Kong SAR, ChinaHungaryIBRD onlyIcelandIDA & IBRD totalIDA blendIDA onlyIDA totalIndiaIndonesiaIran, Islamic Rep.IraqIrelandIsraelItalyJamaicaJapanJordanKazakhstanKenyaKorea, Rep.KosovoKuwaitKyrgyz RepublicLao PDRLate-demographic dividendLatin America & Caribbean Latin America & Caribbean (excluding high income)Latin America & the Caribbean (IDA & IBRD countries)LatviaLeast developed countries: UN classificationLebanonLesothoLiberiaLibyaLithuaniaLow & middle incomeLow incomeLower middle incomeLuxembourgMacao SAR, ChinaMacedonia, FYRMadagascarMalawiMalaysiaMaldivesMaliMaltaMauritaniaMauritiusMexicoMicronesia, Fed. Sts.Middle East & North AfricaMiddle East & North Africa (excluding high income)Middle East & North Africa (IDA & IBRD countries)Middle incomeMoldovaMongoliaMontenegroMoroccoMozambiqueMyanmarNamibiaNepalNetherlandsNew ZealandNicaraguaNigerNigeriaNorth AmericaNorwayOECD membersOmanOther small statesPacific island small statesPakistanPanamaPapua New GuineaParaguayPeruPhilippinesPolandPortugalPost-demographic dividendPre-demographic dividendQatarRomaniaRussian FederationRwandaSamoaSao Tome and PrincipeSaudi ArabiaSenegalSerbiaSeychellesSierra LeoneSingaporeSlovak RepublicSloveniaSmall statesSolomon IslandsSouth AfricaSouth AsiaSouth Asia (IDA & IBRD)South SudanSpainSri LankaSt. Kitts and NevisSt. LuciaSt. Vincent and the GrenadinesSub-Saharan Africa Sub-Saharan Africa (excluding high income)Sub-Saharan Africa (IDA & IBRD countries)SudanSurinameSwazilandSwedenSwitzerlandSyrian Arab RepublicTajikistanTanzaniaThailandTimor-LesteTogoTongaTrinidad and TobagoTunisiaTurkeyUgandaUkraineUnited Arab EmiratesUnited KingdomUnited StatesUpper middle incomeUruguayVanuatuVenezuela, RBVietnamWest Bank and GazaWorldYemen, Rep.ZambiaZimbabwe Timeline:
This timeline shows a graph from 1961 to 2016 of Brazil. No data until 1960. Number of actual observations by date: 54.
Source name:
World Development Indicators
Source organization:
International Monetary Fund, International Financial Statistics and data files, and World Bank and OECD GDP estimates.
Categories, topics:
Financial Sector, Private Sector
Last updated:
apr 23, 2017
Indicators value changes by year
Minimum:
12.434
jan 1, 1967
Maximum:
134.114
jan 1, 1994
At the date of observation
Value
Absolute change
Change from previous value
jan 1, 1961
20.183
+20.183
0.0%
jan 1, 1962
19.3
-0.883
-4.37%
jan 1, 1963
16.435
-2.865
-14.84%
jan 1, 1964
14.876
-1.559
-9.49%
jan 1, 1965
13.365
-1.51
-10.15%
jan 1, 1966
13.492
+0.127
0.95%
jan 1, 1967
12.434
-1.059
-7.85%
jan 1, 1968
14.439
+2.006
16.13%
jan 1, 1969
16.678
+2.239
15.5%
jan 1, 1970
26.518
+9.841
59.0%
jan 1, 1971
30.892
+4.374
16.49%
jan 1, 1972
37.298
+6.406
20.74%
jan 1, 1973
41.763
+4.464
11.97%
jan 1, 1974
44.085
+2.322
5.56%
jan 1, 1975
48.212
+4.127
9.36%
jan 1, 1976
54.931
+6.72
13.94%
jan 1, 1977
54.644
-0.288
-0.52%
jan 1, 1978
54.446
-0.198
-0.36%
jan 1, 1979
50.294
-4.152
-7.63%
jan 1, 1980
50.189
-0.104
-0.21%
jan 1, 1981
42.478
-7.712
-15.37%
jan 1, 1982
43.751
+1.273
3.0%
jan 1, 1983
43.972
+0.221
0.51%
jan 1, 1984
47.088
+3.115
7.09%
jan 1, 1985
45.407
-1.681
-3.57%
jan 1, 1986
41.852
-3.555
-7.83%
jan 1, 1989
98.353
+56.501
135.0%
jan 1, 1990
127.747
+29.394
29.89%
jan 1, 1991
42.083
-85.664
-67.06%
jan 1, 1992
45.159
+3.077
7.31%
jan 1, 1993
84.466
+39.307
87.04%
jan 1, 1994
134.114
+49.648
58.78%
jan 1, 1995
68.043
-66.071
-49.26%
jan 1, 1996
42.59
-25.453
-37.41%
jan 1, 1997
40.779
-1.811
-4.25%
jan 1, 1998
40.852
+0.074
0.18%
jan 1, 1999
29.532
-11.32
-27.71%
jan 1, 2000
29.827
+0.295
1.0%
jan 1, 2001
31.141
+1.314
4.41%
jan 1, 2002
29.004
-2.137
-6.86%
jan 1, 2003
29.645
+0.641
2.21%
jan 1, 2004
27.686
-1.959
-6.61%
jan 1, 2005
29.373
+1.687
6.09%
jan 1, 2006
31.84
+2.467
8.4%
jan 1, 2007
35.425
+3.585
11.26%
jan 1, 2008
40.691
+5.266
14.86%
jan 1, 2009
45.782
+5.091
12.51%
jan 1, 2010
47.494
+1.712
3.74%
jan 1, 2011
52.765
+5.27
11.1%
jan 1, 2012
58.115
+5.35
10.14%
jan 1, 2013
62.634
+4.52
7.78%
jan 1, 2014
64.414
+1.779
2.84%
jan 1, 2015
67.092
+2.679
4.16%
jan 1, 2016
67.865
+0.772
1.15%
Ranking of countries by current statistics by years


Comments: