29
/
en
AIzaSyAYiBZKx7MnpbEhh9jyipgxe19OcubqV5w
April 1, 2024
214172
Norway
NOR
true
2
1
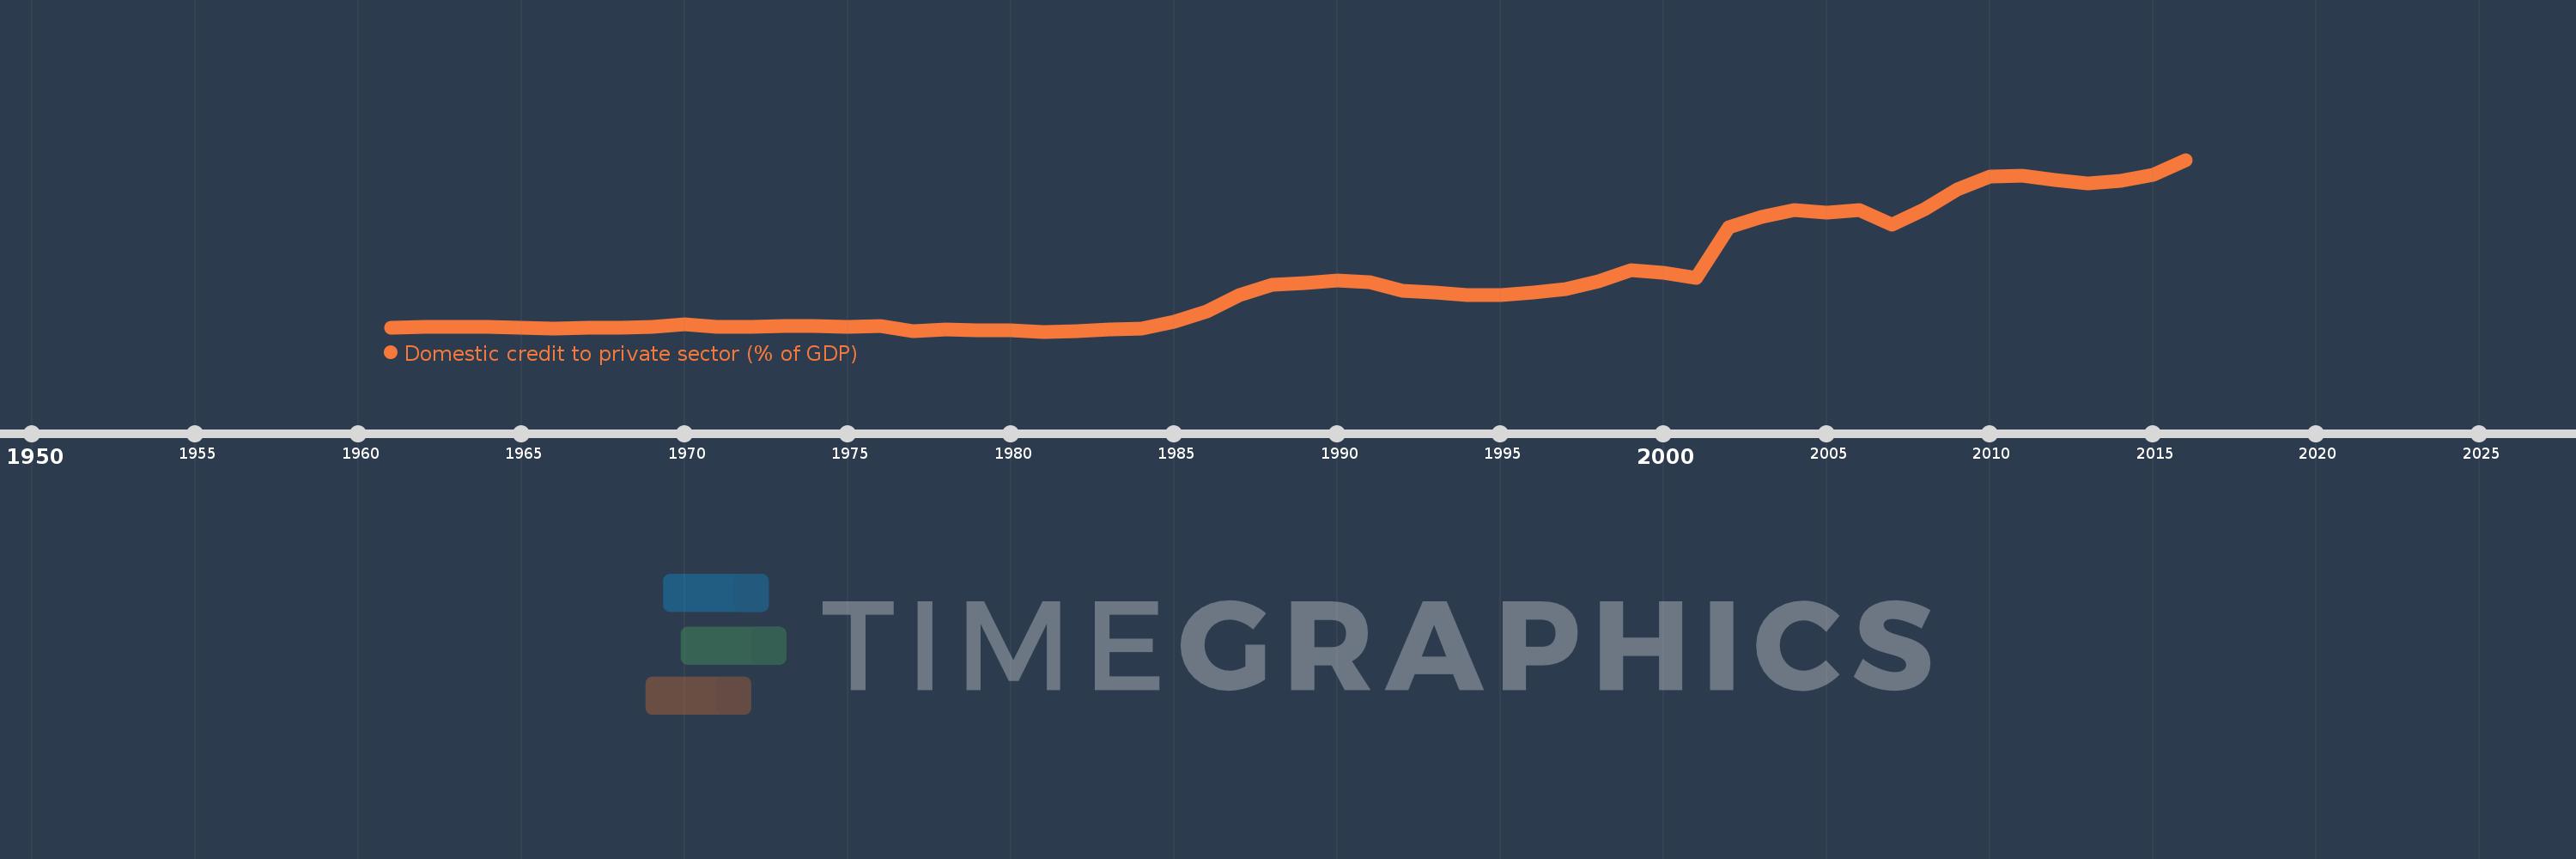
Domestic credit to private sector (% of GDP)
2016,2015,2014,2013,2012,2011,2010,2009,2008,2007,2006,2005,2004,2003,2002,2001,2000,1999,1998,1997,1996,1995,1994,1993,1992,1991,1990,1989,1988,1987,1986,1985,1984,1983,1982,1981,1980,1979,1978,1977,1976,1975,1974,1973,1972,1971,1970,1969,1968,1967,1966,1965,1964,1963,1962,1961
This statistics in other country:
AfghanistanAlbaniaAlgeriaAngolaAntigua and BarbudaArab WorldArgentinaArmeniaArubaAustraliaAustriaAzerbaijanBahamas, TheBahrainBangladeshBarbadosBelarusBelgiumBelizeBeninBhutanBoliviaBosnia and HerzegovinaBotswanaBrazilBrunei DarussalamBulgariaBurkina FasoBurundiCabo VerdeCambodiaCameroonCanadaCaribbean small statesCentral African RepublicCentral Europe and the BalticsChadChileChinaColombiaComorosCongo, Dem. Rep.Congo, Rep.Costa RicaCote d'IvoireCroatiaCyprusCzech RepublicDenmarkDjiboutiDominicaDominican RepublicEarly-demographic dividendEast Asia & PacificEast Asia & Pacific (excluding high income)East Asia & Pacific (IDA & IBRD countries)EcuadorEgypt, Arab Rep.El SalvadorEquatorial GuineaEritreaEstoniaEthiopiaEuro areaEurope & Central AsiaEurope & Central Asia (excluding high income)Europe & Central Asia (IDA & IBRD countries)European UnionFijiFinlandFragile and conflict affected situationsFranceGabonGambia, TheGeorgiaGermanyGhanaGreeceGrenadaGuatemalaGuineaGuinea-BissauGuyanaHaitiHeavily indebted poor countries (HIPC)High incomeHondurasHong Kong SAR, ChinaHungaryIBRD onlyIcelandIDA & IBRD totalIDA blendIDA onlyIDA totalIndiaIndonesiaIran, Islamic Rep.IraqIrelandIsraelItalyJamaicaJapanJordanKazakhstanKenyaKorea, Rep.KosovoKuwaitKyrgyz RepublicLao PDRLate-demographic dividendLatin America & Caribbean Latin America & Caribbean (excluding high income)Latin America & the Caribbean (IDA & IBRD countries)LatviaLeast developed countries: UN classificationLebanonLesothoLiberiaLibyaLithuaniaLow & middle incomeLow incomeLower middle incomeLuxembourgMacao SAR, ChinaMacedonia, FYRMadagascarMalawiMalaysiaMaldivesMaliMaltaMauritaniaMauritiusMexicoMicronesia, Fed. Sts.Middle East & North AfricaMiddle East & North Africa (excluding high income)Middle East & North Africa (IDA & IBRD countries)Middle incomeMoldovaMongoliaMontenegroMoroccoMozambiqueMyanmarNamibiaNepalNetherlandsNew ZealandNicaraguaNigerNigeriaNorth AmericaNorwayOECD membersOmanOther small statesPacific island small statesPakistanPanamaPapua New GuineaParaguayPeruPhilippinesPolandPortugalPost-demographic dividendPre-demographic dividendQatarRomaniaRussian FederationRwandaSamoaSao Tome and PrincipeSaudi ArabiaSenegalSerbiaSeychellesSierra LeoneSingaporeSlovak RepublicSloveniaSmall statesSolomon IslandsSouth AfricaSouth AsiaSouth Asia (IDA & IBRD)South SudanSpainSri LankaSt. Kitts and NevisSt. LuciaSt. Vincent and the GrenadinesSub-Saharan Africa Sub-Saharan Africa (excluding high income)Sub-Saharan Africa (IDA & IBRD countries)SudanSurinameSwazilandSwedenSwitzerlandSyrian Arab RepublicTajikistanTanzaniaThailandTimor-LesteTogoTongaTrinidad and TobagoTunisiaTurkeyUgandaUkraineUnited Arab EmiratesUnited KingdomUnited StatesUpper middle incomeUruguayVanuatuVenezuela, RBVietnamWest Bank and GazaWorldYemen, Rep.ZambiaZimbabwe Timeline:
This timeline shows a graph from 1961 to 2016 of Norway. No data until 1960. Number of actual observations by date: 56.
Source name:
World Development Indicators
Source organization:
International Monetary Fund, International Financial Statistics and data files, and World Bank and OECD GDP estimates.
Categories, topics:
Financial Sector, Private Sector
Last updated:
apr 23, 2017
Indicators value changes by year
Minimum:
30.473
jan 1, 1981
Maximum:
138.419
jan 1, 2016
At the date of observation
Value
Absolute change
Change from previous value
jan 1, 1961
32.737
+32.737
0.0%
jan 1, 1962
33.372
+0.634
1.94%
jan 1, 1963
33.605
+0.233
0.7%
jan 1, 1964
33.445
-0.16
-0.47%
jan 1, 1965
33.058
-0.387
-1.16%
jan 1, 1966
32.104
-0.954
-2.88%
jan 1, 1967
33.066
+0.962
3.0%
jan 1, 1968
32.946
-0.121
-0.37%
jan 1, 1969
33.553
+0.608
1.85%
jan 1, 1970
34.914
+1.361
4.06%
jan 1, 1971
33.366
-1.548
-4.43%
jan 1, 1972
33.674
+0.308
0.92%
jan 1, 1973
34.172
+0.498
1.48%
jan 1, 1974
34.027
-0.146
-0.43%
jan 1, 1975
33.455
-0.571
-1.68%
jan 1, 1976
34.158
+0.702
2.1%
jan 1, 1977
30.683
-3.474
-10.17%
jan 1, 1978
31.765
+1.082
3.53%
jan 1, 1979
31.257
-0.508
-1.6%
jan 1, 1980
31.519
+0.261
0.84%
jan 1, 1981
30.473
-1.046
-3.32%
jan 1, 1982
30.785
+0.312
1.02%
jan 1, 1983
31.573
+0.788
2.56%
jan 1, 1984
32.462
+0.889
2.82%
jan 1, 1985
36.468
+4.006
12.34%
jan 1, 1986
42.97
+6.501
17.83%
jan 1, 1987
53.164
+10.195
23.73%
jan 1, 1988
59.665
+6.501
12.23%
jan 1, 1989
61.221
+1.556
2.61%
jan 1, 1990
62.373
+1.153
1.88%
jan 1, 1991
61.655
-0.718
-1.15%
jan 1, 1992
55.945
-5.71
-9.26%
jan 1, 1993
55.099
-0.846
-1.51%
jan 1, 1994
53.515
-1.584
-2.88%
jan 1, 1995
53.53
+0.015
0.03%
jan 1, 1996
54.827
+1.297
2.42%
jan 1, 1997
56.923
+2.096
3.82%
jan 1, 1998
62.079
+5.156
9.06%
jan 1, 1999
68.957
+6.879
11.08%
jan 1, 2000
67.177
-1.78
-2.58%
jan 1, 2001
64.342
-2.835
-4.22%
jan 1, 2002
96.29
+31.947
49.65%
jan 1, 2003
102.586
+6.296
6.54%
jan 1, 2004
106.885
+4.298
4.19%
jan 1, 2005
105.381
-1.504
-1.41%
jan 1, 2006
107.011
+1.63
1.55%
jan 1, 2007
97.574
-9.437
-8.82%
jan 1, 2008
107.534
+9.96
10.21%
jan 1, 2009
120.015
+12.481
11.61%
jan 1, 2010
128.06
+8.045
6.7%
jan 1, 2011
128.39
+0.33
0.26%
jan 1, 2012
125.782
-2.608
-2.03%
jan 1, 2013
123.423
-2.359
-1.88%
jan 1, 2014
124.987
+1.563
1.27%
jan 1, 2015
129.119
+4.132
3.31%
jan 1, 2016
138.419
+9.3
7.2%
Ranking of countries by current statistics by years


Comments: