29
/
en
AIzaSyAYiBZKx7MnpbEhh9jyipgxe19OcubqV5w
April 1, 2024
38894
IDA only
IDX
false
2
1
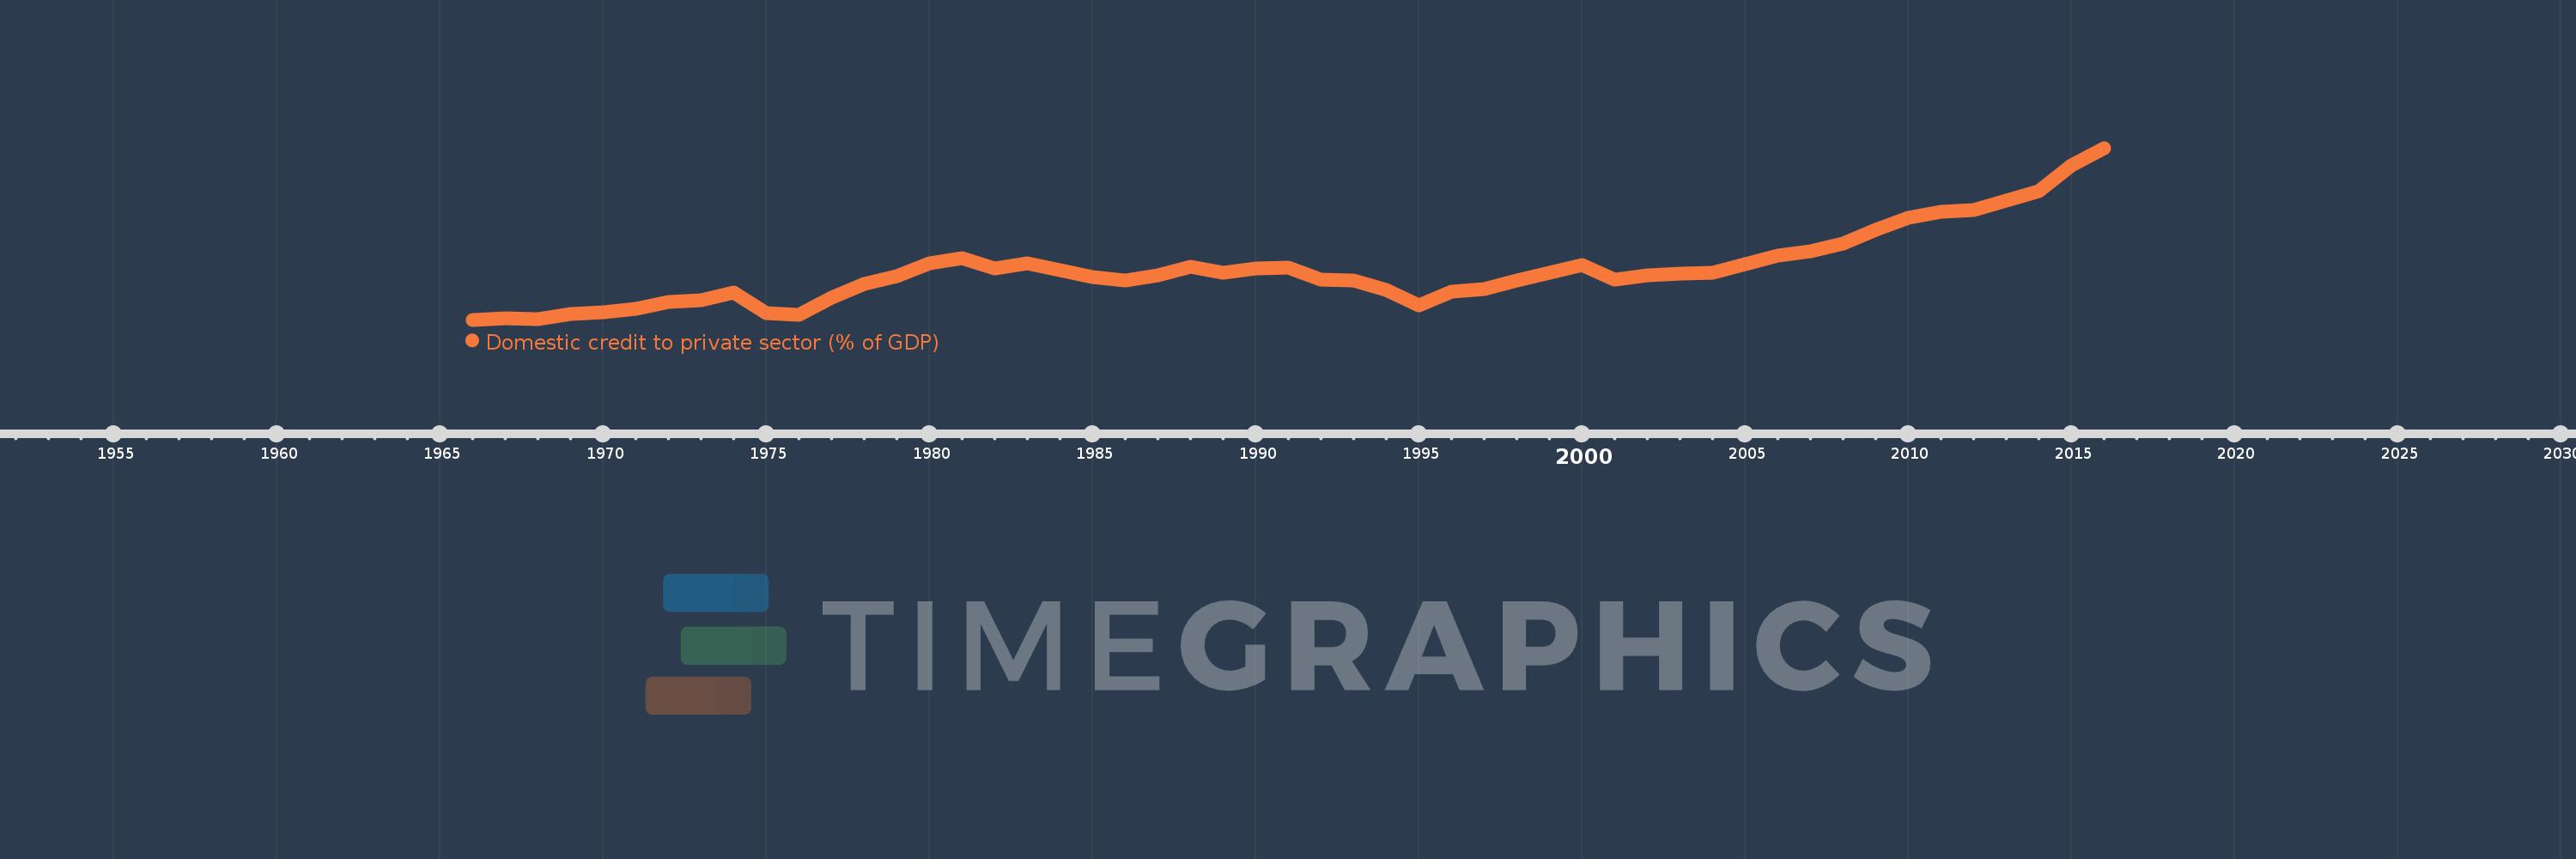
Domestic credit to private sector (% of GDP)
2016,2015,2014,2013,2012,2011,2010,2009,2008,2007,2006,2005,2004,2003,2002,2001,2000,1999,1998,1997,1996,1995,1994,1993,1992,1991,1990,1989,1988,1987,1986,1985,1984,1983,1982,1981,1980,1979,1978,1977,1976,1975,1974,1973,1972,1971,1970,1969,1968,1967,1966
This statistics in other country:
AfghanistanAlbaniaAlgeriaAngolaAntigua and BarbudaArab WorldArgentinaArmeniaArubaAustraliaAustriaAzerbaijanBahamas, TheBahrainBangladeshBarbadosBelarusBelgiumBelizeBeninBhutanBoliviaBosnia and HerzegovinaBotswanaBrazilBrunei DarussalamBulgariaBurkina FasoBurundiCabo VerdeCambodiaCameroonCanadaCaribbean small statesCentral African RepublicCentral Europe and the BalticsChadChileChinaColombiaComorosCongo, Dem. Rep.Congo, Rep.Costa RicaCote d'IvoireCroatiaCyprusCzech RepublicDenmarkDjiboutiDominicaDominican RepublicEarly-demographic dividendEast Asia & PacificEast Asia & Pacific (excluding high income)East Asia & Pacific (IDA & IBRD countries)EcuadorEgypt, Arab Rep.El SalvadorEquatorial GuineaEritreaEstoniaEthiopiaEuro areaEurope & Central AsiaEurope & Central Asia (excluding high income)Europe & Central Asia (IDA & IBRD countries)European UnionFijiFinlandFragile and conflict affected situationsFranceGabonGambia, TheGeorgiaGermanyGhanaGreeceGrenadaGuatemalaGuineaGuinea-BissauGuyanaHaitiHeavily indebted poor countries (HIPC)High incomeHondurasHong Kong SAR, ChinaHungaryIBRD onlyIcelandIDA & IBRD totalIDA blendIDA onlyIDA totalIndiaIndonesiaIran, Islamic Rep.IraqIrelandIsraelItalyJamaicaJapanJordanKazakhstanKenyaKorea, Rep.KosovoKuwaitKyrgyz RepublicLao PDRLate-demographic dividendLatin America & Caribbean Latin America & Caribbean (excluding high income)Latin America & the Caribbean (IDA & IBRD countries)LatviaLeast developed countries: UN classificationLebanonLesothoLiberiaLibyaLithuaniaLow & middle incomeLow incomeLower middle incomeLuxembourgMacao SAR, ChinaMacedonia, FYRMadagascarMalawiMalaysiaMaldivesMaliMaltaMauritaniaMauritiusMexicoMicronesia, Fed. Sts.Middle East & North AfricaMiddle East & North Africa (excluding high income)Middle East & North Africa (IDA & IBRD countries)Middle incomeMoldovaMongoliaMontenegroMoroccoMozambiqueMyanmarNamibiaNepalNetherlandsNew ZealandNicaraguaNigerNigeriaNorth AmericaNorwayOECD membersOmanOther small statesPacific island small statesPakistanPanamaPapua New GuineaParaguayPeruPhilippinesPolandPortugalPost-demographic dividendPre-demographic dividendQatarRomaniaRussian FederationRwandaSamoaSao Tome and PrincipeSaudi ArabiaSenegalSerbiaSeychellesSierra LeoneSingaporeSlovak RepublicSloveniaSmall statesSolomon IslandsSouth AfricaSouth AsiaSouth Asia (IDA & IBRD)South SudanSpainSri LankaSt. Kitts and NevisSt. LuciaSt. Vincent and the GrenadinesSub-Saharan Africa Sub-Saharan Africa (excluding high income)Sub-Saharan Africa (IDA & IBRD countries)SudanSurinameSwazilandSwedenSwitzerlandSyrian Arab RepublicTajikistanTanzaniaThailandTimor-LesteTogoTongaTrinidad and TobagoTunisiaTurkeyUgandaUkraineUnited Arab EmiratesUnited KingdomUnited StatesUpper middle incomeUruguayVanuatuVenezuela, RBVietnamWest Bank and GazaWorldYemen, Rep.ZambiaZimbabwe Timeline:
This timeline shows a graph from 1966 to 2016 of IDA only. No data until 1965. Number of actual observations by date: 51.
Source name:
World Development Indicators
Source organization:
International Monetary Fund, International Financial Statistics and data files, and World Bank and OECD GDP estimates.
Categories, topics:
Financial Sector, Private Sector
Last updated:
apr 23, 2017
Indicators value changes by year
Minimum:
10.128
jan 1, 1966
Maximum:
27.179
jan 1, 2016
At the date of observation
Value
Absolute change
Change from previous value
jan 1, 1966
10.128
+10.128
0.0%
jan 1, 1967
10.249
+0.121
1.19%
jan 1, 1968
10.208
-0.041
-0.4%
jan 1, 1969
10.69
+0.481
4.72%
jan 1, 1970
10.868
+0.178
1.67%
jan 1, 1971
11.196
+0.328
3.02%
jan 1, 1972
11.857
+0.661
5.9%
jan 1, 1973
12.064
+0.207
1.75%
jan 1, 1974
12.815
+0.75
6.22%
jan 1, 1975
10.766
-2.049
-15.99%
jan 1, 1976
10.63
-0.136
-1.26%
jan 1, 1977
12.293
+1.663
15.65%
jan 1, 1978
13.662
+1.368
11.13%
jan 1, 1979
14.472
+0.81
5.93%
jan 1, 1980
15.712
+1.24
8.57%
jan 1, 1981
16.237
+0.525
3.34%
jan 1, 1982
15.19
-1.047
-6.45%
jan 1, 1983
15.687
+0.496
3.27%
jan 1, 1984
15.02
-0.667
-4.25%
jan 1, 1985
14.326
-0.694
-4.62%
jan 1, 1986
14.016
-0.31
-2.16%
jan 1, 1987
14.506
+0.489
3.49%
jan 1, 1988
15.422
+0.916
6.32%
jan 1, 1989
14.834
-0.588
-3.81%
jan 1, 1990
15.229
+0.395
2.66%
jan 1, 1991
15.263
+0.034
0.22%
jan 1, 1992
14.113
-1.15
-7.53%
jan 1, 1993
14.048
-0.066
-0.46%
jan 1, 1994
13.07
-0.977
-6.96%
jan 1, 1995
11.527
-1.543
-11.81%
jan 1, 1996
12.926
+1.399
12.13%
jan 1, 1997
13.172
+0.247
1.91%
jan 1, 1998
14.062
+0.89
6.75%
jan 1, 1999
14.783
+0.721
5.13%
jan 1, 2000
15.547
+0.764
5.17%
jan 1, 2001
14.117
-1.43
-9.2%
jan 1, 2002
14.561
+0.444
3.15%
jan 1, 2003
14.713
+0.152
1.04%
jan 1, 2004
14.789
+0.076
0.52%
jan 1, 2005
15.649
+0.86
5.81%
jan 1, 2006
16.481
+0.832
5.31%
jan 1, 2007
16.92
+0.439
2.67%
jan 1, 2008
17.683
+0.763
4.51%
jan 1, 2009
19.018
+1.335
7.55%
jan 1, 2010
20.214
+1.196
6.29%
jan 1, 2011
20.838
+0.624
3.09%
jan 1, 2012
20.998
+0.16
0.77%
jan 1, 2013
21.988
+0.989
4.71%
jan 1, 2014
22.881
+0.893
4.06%
jan 1, 2015
25.448
+2.568
11.22%
jan 1, 2016
27.179
+1.731
6.8%
Ranking of countries by current statistics by years


Comments: