29
/
en
AIzaSyAYiBZKx7MnpbEhh9jyipgxe19OcubqV5w
April 1, 2024
159273
Ireland
IRL
true
2
1
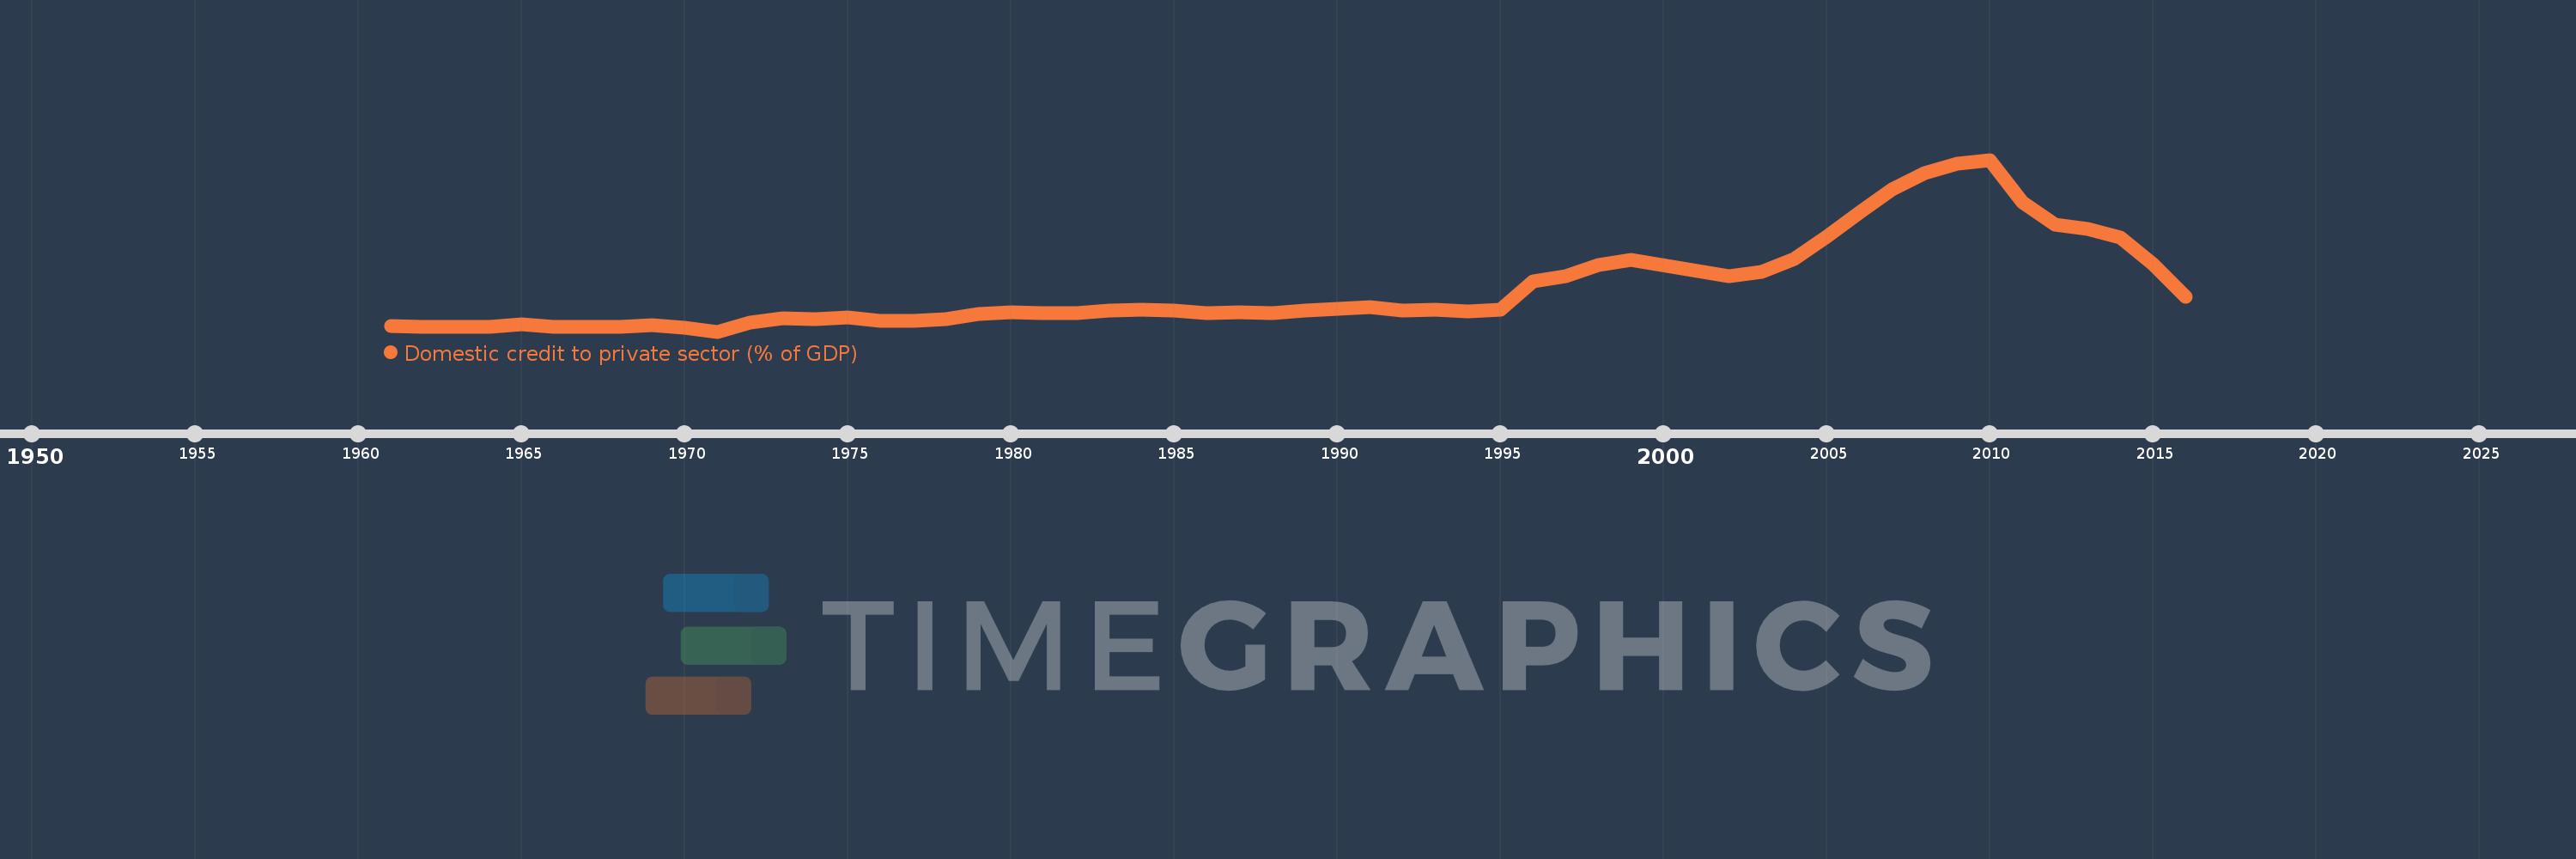
Domestic credit to private sector (% of GDP)
2016,2015,2014,2013,2012,2011,2010,2009,2008,2007,2006,2005,2004,2003,2002,1999,1998,1997,1996,1995,1994,1993,1992,1991,1990,1989,1988,1987,1986,1985,1984,1983,1982,1981,1980,1979,1978,1977,1976,1975,1974,1973,1972,1971,1970,1969,1968,1967,1966,1965,1964,1963,1962,1961
This statistics in other country:
AfghanistanAlbaniaAlgeriaAngolaAntigua and BarbudaArab WorldArgentinaArmeniaArubaAustraliaAustriaAzerbaijanBahamas, TheBahrainBangladeshBarbadosBelarusBelgiumBelizeBeninBhutanBoliviaBosnia and HerzegovinaBotswanaBrazilBrunei DarussalamBulgariaBurkina FasoBurundiCabo VerdeCambodiaCameroonCanadaCaribbean small statesCentral African RepublicCentral Europe and the BalticsChadChileChinaColombiaComorosCongo, Dem. Rep.Congo, Rep.Costa RicaCote d'IvoireCroatiaCyprusCzech RepublicDenmarkDjiboutiDominicaDominican RepublicEarly-demographic dividendEast Asia & PacificEast Asia & Pacific (excluding high income)East Asia & Pacific (IDA & IBRD countries)EcuadorEgypt, Arab Rep.El SalvadorEquatorial GuineaEritreaEstoniaEthiopiaEuro areaEurope & Central AsiaEurope & Central Asia (excluding high income)Europe & Central Asia (IDA & IBRD countries)European UnionFijiFinlandFragile and conflict affected situationsFranceGabonGambia, TheGeorgiaGermanyGhanaGreeceGrenadaGuatemalaGuineaGuinea-BissauGuyanaHaitiHeavily indebted poor countries (HIPC)High incomeHondurasHong Kong SAR, ChinaHungaryIBRD onlyIcelandIDA & IBRD totalIDA blendIDA onlyIDA totalIndiaIndonesiaIran, Islamic Rep.IraqIrelandIsraelItalyJamaicaJapanJordanKazakhstanKenyaKorea, Rep.KosovoKuwaitKyrgyz RepublicLao PDRLate-demographic dividendLatin America & Caribbean Latin America & Caribbean (excluding high income)Latin America & the Caribbean (IDA & IBRD countries)LatviaLeast developed countries: UN classificationLebanonLesothoLiberiaLibyaLithuaniaLow & middle incomeLow incomeLower middle incomeLuxembourgMacao SAR, ChinaMacedonia, FYRMadagascarMalawiMalaysiaMaldivesMaliMaltaMauritaniaMauritiusMexicoMicronesia, Fed. Sts.Middle East & North AfricaMiddle East & North Africa (excluding high income)Middle East & North Africa (IDA & IBRD countries)Middle incomeMoldovaMongoliaMontenegroMoroccoMozambiqueMyanmarNamibiaNepalNetherlandsNew ZealandNicaraguaNigerNigeriaNorth AmericaNorwayOECD membersOmanOther small statesPacific island small statesPakistanPanamaPapua New GuineaParaguayPeruPhilippinesPolandPortugalPost-demographic dividendPre-demographic dividendQatarRomaniaRussian FederationRwandaSamoaSao Tome and PrincipeSaudi ArabiaSenegalSerbiaSeychellesSierra LeoneSingaporeSlovak RepublicSloveniaSmall statesSolomon IslandsSouth AfricaSouth AsiaSouth Asia (IDA & IBRD)South SudanSpainSri LankaSt. Kitts and NevisSt. LuciaSt. Vincent and the GrenadinesSub-Saharan Africa Sub-Saharan Africa (excluding high income)Sub-Saharan Africa (IDA & IBRD countries)SudanSurinameSwazilandSwedenSwitzerlandSyrian Arab RepublicTajikistanTanzaniaThailandTimor-LesteTogoTongaTrinidad and TobagoTunisiaTurkeyUgandaUkraineUnited Arab EmiratesUnited KingdomUnited StatesUpper middle incomeUruguayVanuatuVenezuela, RBVietnamWest Bank and GazaWorldYemen, Rep.ZambiaZimbabwe Timeline:
This timeline shows a graph from 1961 to 2016 of Ireland. No data until 1960. Number of actual observations by date: 54.
Source name:
World Development Indicators
Source organization:
International Monetary Fund, International Financial Statistics and data files, and World Bank and OECD GDP estimates.
Categories, topics:
Financial Sector, Private Sector
Last updated:
apr 23, 2017
Indicators value changes by year
Minimum:
25.152
jan 1, 1971
Maximum:
169.068
jan 1, 2010
At the date of observation
Value
Absolute change
Change from previous value
jan 1, 1961
30.089
+30.089
0.0%
jan 1, 1962
29.126
-0.962
-3.2%
jan 1, 1963
29.346
+0.22
0.75%
jan 1, 1964
29.349
+0.004
0.01%
jan 1, 1965
31.04
+1.691
5.76%
jan 1, 1966
29.391
-1.65
-5.31%
jan 1, 1967
29.317
-0.074
-0.25%
jan 1, 1968
28.852
-0.465
-1.59%
jan 1, 1969
30.244
+1.393
4.83%
jan 1, 1970
28.282
-1.963
-6.49%
jan 1, 1971
25.152
-3.129
-11.06%
jan 1, 1972
32.717
+7.565
30.07%
jan 1, 1973
36.202
+3.485
10.65%
jan 1, 1974
35.613
-0.588
-1.63%
jan 1, 1975
37.171
+1.558
4.37%
jan 1, 1976
34.258
-2.913
-7.84%
jan 1, 1977
34.445
+0.187
0.55%
jan 1, 1978
35.858
+1.413
4.1%
jan 1, 1979
40.058
+4.199
11.71%
jan 1, 1980
41.116
+1.059
2.64%
jan 1, 1981
40.589
-0.528
-1.28%
jan 1, 1982
40.633
+0.045
0.11%
jan 1, 1983
42.77
+2.136
5.26%
jan 1, 1984
43.22
+0.451
1.05%
jan 1, 1985
42.523
-0.697
-1.61%
jan 1, 1986
40.724
-1.799
-4.23%
jan 1, 1987
41.223
+0.499
1.23%
jan 1, 1988
40.386
-0.837
-2.03%
jan 1, 1989
42.51
+2.124
5.26%
jan 1, 1990
44.02
+1.509
3.55%
jan 1, 1991
45.626
+1.606
3.65%
jan 1, 1992
42.876
-2.75
-6.03%
jan 1, 1993
43.531
+0.655
1.53%
jan 1, 1994
41.748
-1.782
-4.09%
jan 1, 1995
43.361
+1.612
3.86%
jan 1, 1996
67.425
+24.064
55.5%
jan 1, 1997
71.659
+4.234
6.28%
jan 1, 1998
80.646
+8.988
12.54%
jan 1, 1999
85.363
+4.717
5.85%
jan 1, 2002
71.864
-13.499
-15.81%
jan 1, 2003
75.433
+3.569
4.97%
jan 1, 2004
85.731
+10.298
13.65%
jan 1, 2005
104.978
+19.247
22.45%
jan 1, 2006
124.707
+19.729
18.79%
jan 1, 2007
144.458
+19.751
15.84%
jan 1, 2008
157.92
+13.462
9.32%
jan 1, 2009
165.964
+8.045
5.09%
jan 1, 2010
169.068
+3.104
1.87%
jan 1, 2011
133.531
-35.537
-21.02%
jan 1, 2012
114.775
-18.756
-14.05%
jan 1, 2013
111.183
-3.592
-3.13%
jan 1, 2014
103.939
-7.244
-6.52%
jan 1, 2015
81.38
-22.558
-21.7%
jan 1, 2016
54.345
-27.035
-33.22%
Ranking of countries by current statistics by years


Comments: