29
/
en
AIzaSyAYiBZKx7MnpbEhh9jyipgxe19OcubqV5w
April 1, 2024
112093
Costa Rica
CRI
true
2
1
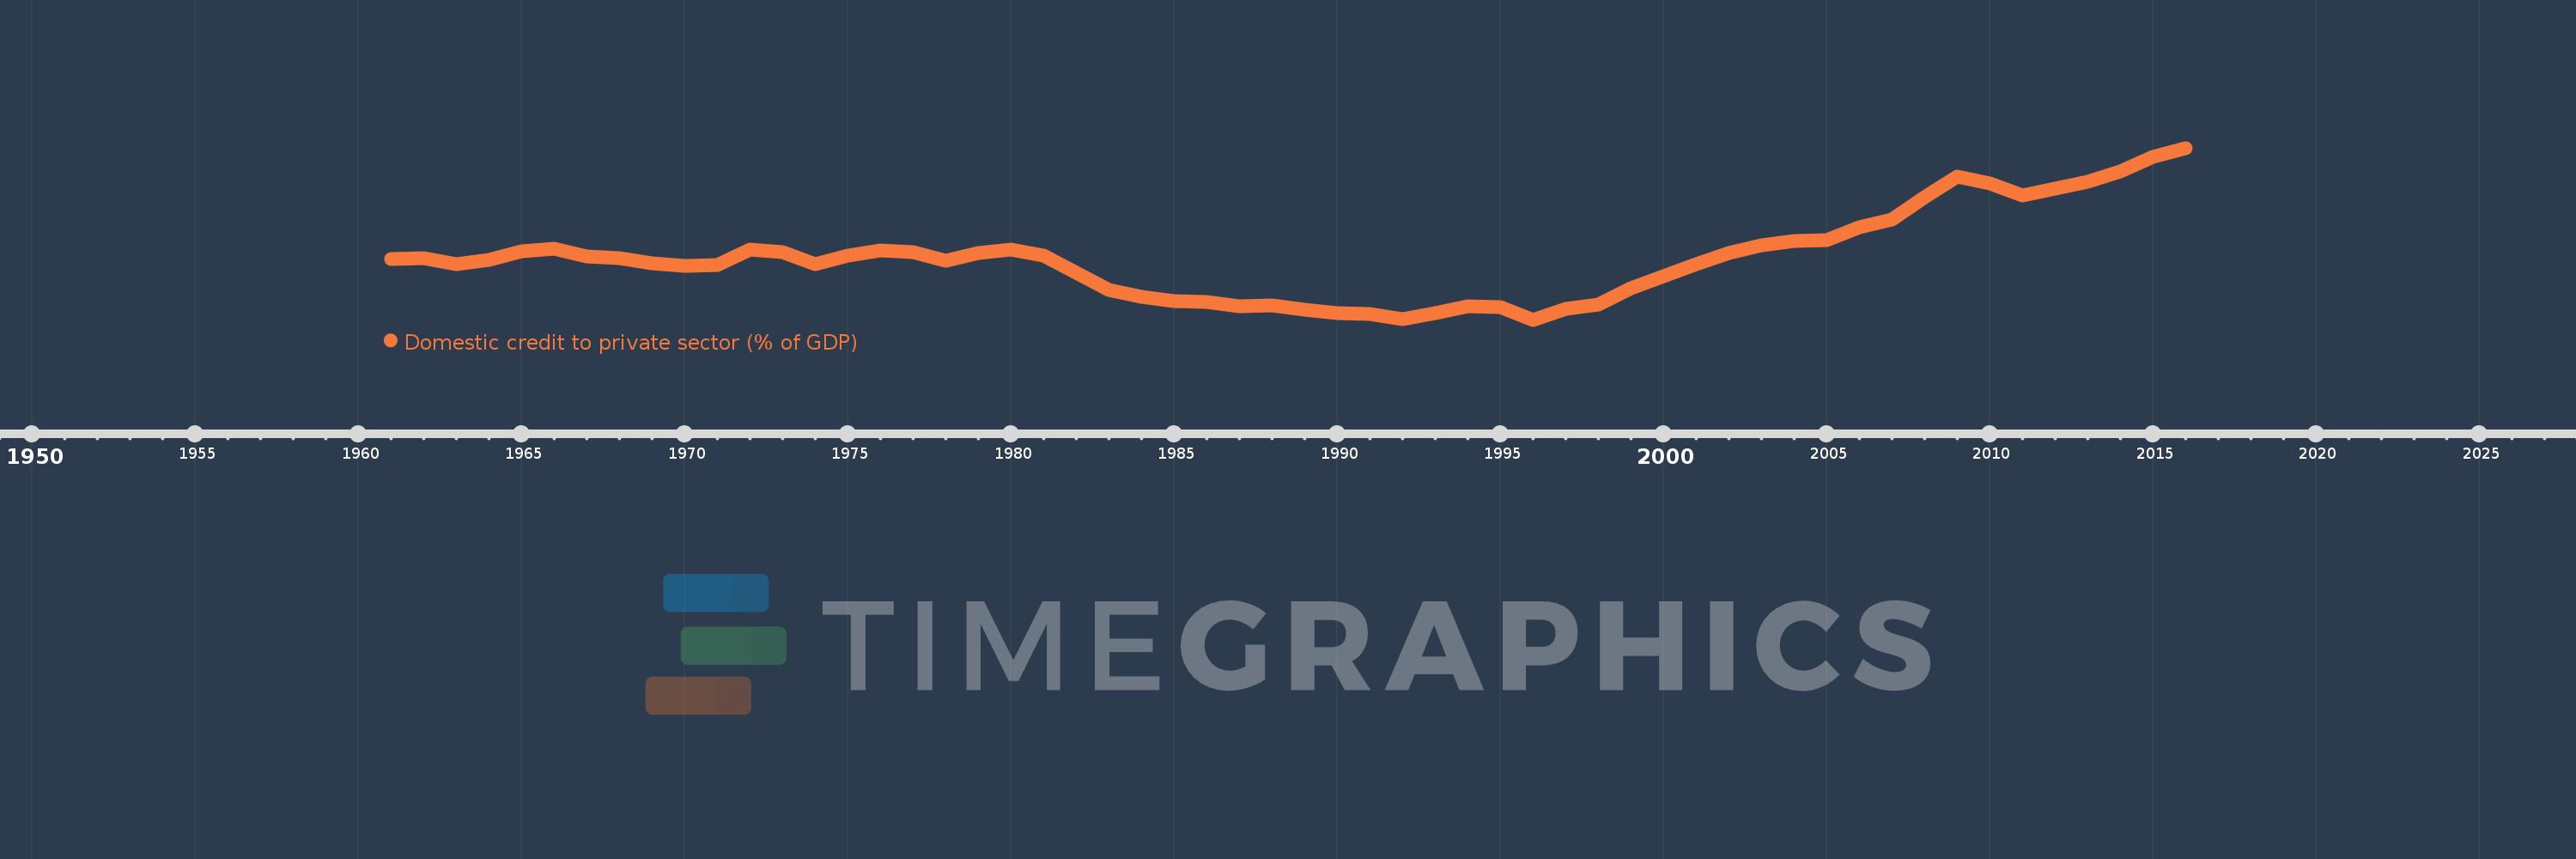
Domestic credit to private sector (% of GDP)
2016,2015,2014,2013,2012,2011,2010,2009,2008,2007,2006,2005,2004,2003,2002,2001,2000,1999,1998,1997,1996,1995,1994,1993,1992,1991,1990,1989,1988,1987,1986,1985,1984,1983,1982,1981,1980,1979,1978,1977,1976,1975,1974,1973,1972,1971,1970,1969,1968,1967,1966,1965,1964,1963,1962,1961
This statistics in other country:
AfghanistanAlbaniaAlgeriaAngolaAntigua and BarbudaArab WorldArgentinaArmeniaArubaAustraliaAustriaAzerbaijanBahamas, TheBahrainBangladeshBarbadosBelarusBelgiumBelizeBeninBhutanBoliviaBosnia and HerzegovinaBotswanaBrazilBrunei DarussalamBulgariaBurkina FasoBurundiCabo VerdeCambodiaCameroonCanadaCaribbean small statesCentral African RepublicCentral Europe and the BalticsChadChileChinaColombiaComorosCongo, Dem. Rep.Congo, Rep.Costa RicaCote d'IvoireCroatiaCyprusCzech RepublicDenmarkDjiboutiDominicaDominican RepublicEarly-demographic dividendEast Asia & PacificEast Asia & Pacific (excluding high income)East Asia & Pacific (IDA & IBRD countries)EcuadorEgypt, Arab Rep.El SalvadorEquatorial GuineaEritreaEstoniaEthiopiaEuro areaEurope & Central AsiaEurope & Central Asia (excluding high income)Europe & Central Asia (IDA & IBRD countries)European UnionFijiFinlandFragile and conflict affected situationsFranceGabonGambia, TheGeorgiaGermanyGhanaGreeceGrenadaGuatemalaGuineaGuinea-BissauGuyanaHaitiHeavily indebted poor countries (HIPC)High incomeHondurasHong Kong SAR, ChinaHungaryIBRD onlyIcelandIDA & IBRD totalIDA blendIDA onlyIDA totalIndiaIndonesiaIran, Islamic Rep.IraqIrelandIsraelItalyJamaicaJapanJordanKazakhstanKenyaKorea, Rep.KosovoKuwaitKyrgyz RepublicLao PDRLate-demographic dividendLatin America & Caribbean Latin America & Caribbean (excluding high income)Latin America & the Caribbean (IDA & IBRD countries)LatviaLeast developed countries: UN classificationLebanonLesothoLiberiaLibyaLithuaniaLow & middle incomeLow incomeLower middle incomeLuxembourgMacao SAR, ChinaMacedonia, FYRMadagascarMalawiMalaysiaMaldivesMaliMaltaMauritaniaMauritiusMexicoMicronesia, Fed. Sts.Middle East & North AfricaMiddle East & North Africa (excluding high income)Middle East & North Africa (IDA & IBRD countries)Middle incomeMoldovaMongoliaMontenegroMoroccoMozambiqueMyanmarNamibiaNepalNetherlandsNew ZealandNicaraguaNigerNigeriaNorth AmericaNorwayOECD membersOmanOther small statesPacific island small statesPakistanPanamaPapua New GuineaParaguayPeruPhilippinesPolandPortugalPost-demographic dividendPre-demographic dividendQatarRomaniaRussian FederationRwandaSamoaSao Tome and PrincipeSaudi ArabiaSenegalSerbiaSeychellesSierra LeoneSingaporeSlovak RepublicSloveniaSmall statesSolomon IslandsSouth AfricaSouth AsiaSouth Asia (IDA & IBRD)South SudanSpainSri LankaSt. Kitts and NevisSt. LuciaSt. Vincent and the GrenadinesSub-Saharan Africa Sub-Saharan Africa (excluding high income)Sub-Saharan Africa (IDA & IBRD countries)SudanSurinameSwazilandSwedenSwitzerlandSyrian Arab RepublicTajikistanTanzaniaThailandTimor-LesteTogoTongaTrinidad and TobagoTunisiaTurkeyUgandaUkraineUnited Arab EmiratesUnited KingdomUnited StatesUpper middle incomeUruguayVanuatuVenezuela, RBVietnamWest Bank and GazaWorldYemen, Rep.ZambiaZimbabwe Timeline:
This timeline shows a graph from 1961 to 2016 of Costa Rica. No data until 1960. Number of actual observations by date: 56.
Source name:
World Development Indicators
Source organization:
International Monetary Fund, International Financial Statistics and data files, and World Bank and OECD GDP estimates.
Categories, topics:
Financial Sector, Private Sector
Last updated:
apr 23, 2017
Indicators value changes by year
Minimum:
10.782
jan 1, 1996
Maximum:
56.793
jan 1, 2016
At the date of observation
Value
Absolute change
Change from previous value
jan 1, 1961
27.048
+27.048
0.0%
jan 1, 1962
27.174
+0.126
0.47%
jan 1, 1963
25.764
-1.41
-5.19%
jan 1, 1964
26.711
+0.947
3.68%
jan 1, 1965
29.214
+2.503
9.37%
jan 1, 1966
29.861
+0.647
2.22%
jan 1, 1967
27.693
-2.168
-7.26%
jan 1, 1968
27.381
-0.312
-1.13%
jan 1, 1969
25.923
-1.458
-5.32%
jan 1, 1970
25.231
-0.692
-2.67%
jan 1, 1971
25.397
+0.165
0.66%
jan 1, 1972
29.592
+4.196
16.52%
jan 1, 1973
28.801
-0.792
-2.68%
jan 1, 1974
25.553
-3.248
-11.28%
jan 1, 1975
27.998
+2.445
9.57%
jan 1, 1976
29.454
+1.457
5.2%
jan 1, 1977
28.863
-0.592
-2.01%
jan 1, 1978
26.605
-2.258
-7.82%
jan 1, 1979
28.732
+2.127
7.99%
jan 1, 1980
29.679
+0.948
3.3%
jan 1, 1981
27.893
-1.786
-6.02%
jan 1, 1982
23.285
-4.608
-16.52%
jan 1, 1983
18.735
-4.55
-19.54%
jan 1, 1984
16.919
-1.816
-9.69%
jan 1, 1985
15.864
-1.056
-6.24%
jan 1, 1986
15.544
-0.32
-2.02%
jan 1, 1987
14.433
-1.111
-7.15%
jan 1, 1988
14.712
+0.279
1.93%
jan 1, 1989
13.513
-1.199
-8.15%
jan 1, 1990
12.492
-1.021
-7.56%
jan 1, 1991
12.218
-0.274
-2.19%
jan 1, 1992
11.048
-1.171
-9.58%
jan 1, 1993
12.506
+1.459
13.21%
jan 1, 1994
14.405
+1.899
15.18%
jan 1, 1995
14.049
-0.356
-2.47%
jan 1, 1996
10.782
-3.267
-23.25%
jan 1, 1997
13.67
+2.888
26.79%
jan 1, 1998
14.874
+1.203
8.8%
jan 1, 1999
19.148
+4.275
28.74%
jan 1, 2000
22.546
+3.398
17.74%
jan 1, 2001
25.613
+3.067
13.6%
jan 1, 2002
28.587
+2.974
11.61%
jan 1, 2003
30.722
+2.136
7.47%
jan 1, 2004
31.91
+1.187
3.86%
jan 1, 2005
32.133
+0.224
0.7%
jan 1, 2006
35.629
+3.496
10.88%
jan 1, 2007
37.728
+2.098
5.89%
jan 1, 2008
43.613
+5.885
15.6%
jan 1, 2009
49.195
+5.583
12.8%
jan 1, 2010
47.261
-1.934
-3.93%
jan 1, 2011
44.113
-3.149
-6.66%
jan 1, 2012
46.006
+1.894
4.29%
jan 1, 2013
47.685
+1.679
3.65%
jan 1, 2014
50.417
+2.731
5.73%
jan 1, 2015
54.437
+4.02
7.97%
jan 1, 2016
56.793
+2.356
4.33%
Ranking of countries by current statistics by years


Comments: