29
/
en
AIzaSyAYiBZKx7MnpbEhh9jyipgxe19OcubqV5w
April 1, 2024
54018
Pacific island small states
PSS
false
2
1
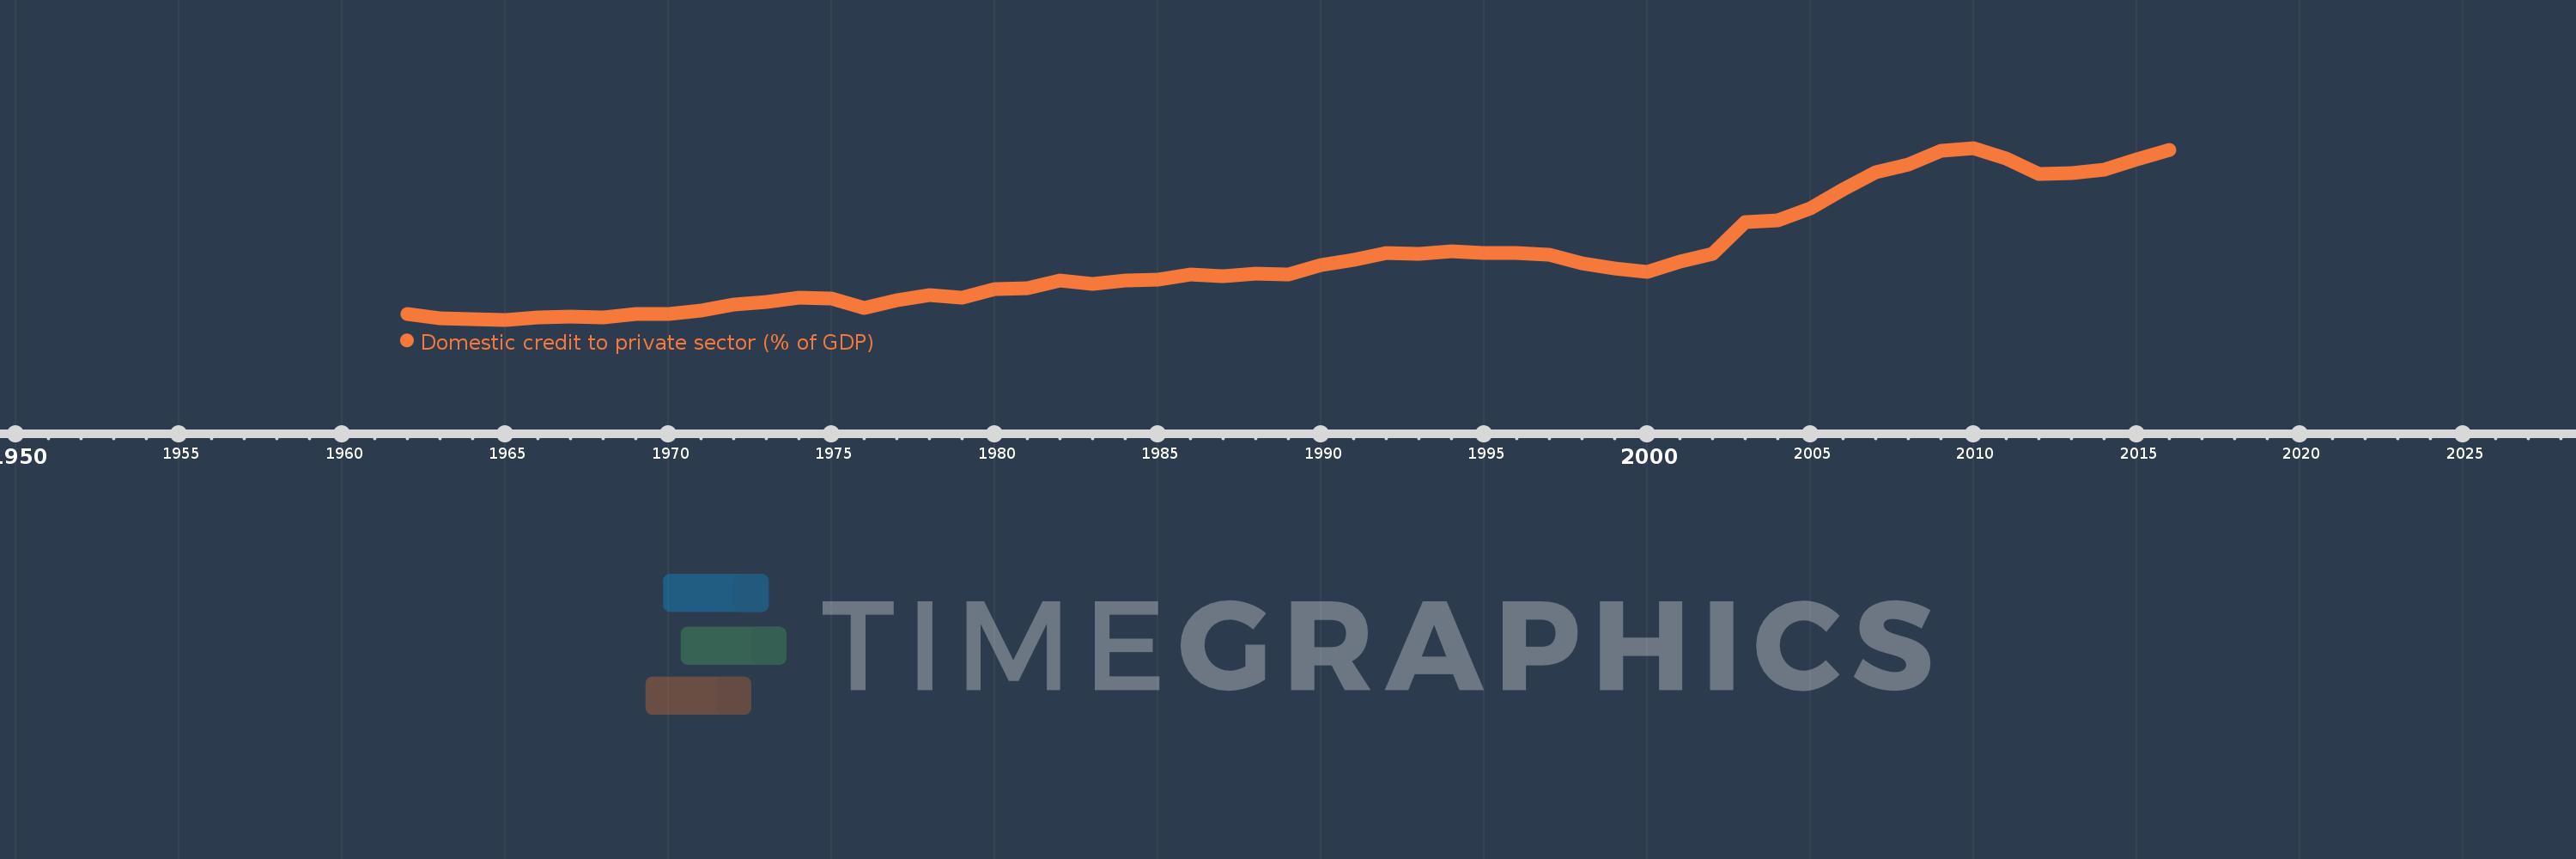
Domestic credit to private sector (% of GDP)
2016,2015,2014,2013,2012,2011,2010,2009,2008,2007,2006,2005,2004,2003,2002,2001,2000,1999,1998,1997,1996,1995,1994,1993,1992,1991,1990,1989,1988,1987,1986,1985,1984,1983,1982,1981,1980,1979,1978,1977,1976,1975,1974,1973,1972,1971,1970,1969,1968,1967,1966,1965,1964,1963,1962
This statistics in other country:
AfghanistanAlbaniaAlgeriaAngolaAntigua and BarbudaArab WorldArgentinaArmeniaArubaAustraliaAustriaAzerbaijanBahamas, TheBahrainBangladeshBarbadosBelarusBelgiumBelizeBeninBhutanBoliviaBosnia and HerzegovinaBotswanaBrazilBrunei DarussalamBulgariaBurkina FasoBurundiCabo VerdeCambodiaCameroonCanadaCaribbean small statesCentral African RepublicCentral Europe and the BalticsChadChileChinaColombiaComorosCongo, Dem. Rep.Congo, Rep.Costa RicaCote d'IvoireCroatiaCyprusCzech RepublicDenmarkDjiboutiDominicaDominican RepublicEarly-demographic dividendEast Asia & PacificEast Asia & Pacific (excluding high income)East Asia & Pacific (IDA & IBRD countries)EcuadorEgypt, Arab Rep.El SalvadorEquatorial GuineaEritreaEstoniaEthiopiaEuro areaEurope & Central AsiaEurope & Central Asia (excluding high income)Europe & Central Asia (IDA & IBRD countries)European UnionFijiFinlandFragile and conflict affected situationsFranceGabonGambia, TheGeorgiaGermanyGhanaGreeceGrenadaGuatemalaGuineaGuinea-BissauGuyanaHaitiHeavily indebted poor countries (HIPC)High incomeHondurasHong Kong SAR, ChinaHungaryIBRD onlyIcelandIDA & IBRD totalIDA blendIDA onlyIDA totalIndiaIndonesiaIran, Islamic Rep.IraqIrelandIsraelItalyJamaicaJapanJordanKazakhstanKenyaKorea, Rep.KosovoKuwaitKyrgyz RepublicLao PDRLate-demographic dividendLatin America & Caribbean Latin America & Caribbean (excluding high income)Latin America & the Caribbean (IDA & IBRD countries)LatviaLeast developed countries: UN classificationLebanonLesothoLiberiaLibyaLithuaniaLow & middle incomeLow incomeLower middle incomeLuxembourgMacao SAR, ChinaMacedonia, FYRMadagascarMalawiMalaysiaMaldivesMaliMaltaMauritaniaMauritiusMexicoMicronesia, Fed. Sts.Middle East & North AfricaMiddle East & North Africa (excluding high income)Middle East & North Africa (IDA & IBRD countries)Middle incomeMoldovaMongoliaMontenegroMoroccoMozambiqueMyanmarNamibiaNepalNetherlandsNew ZealandNicaraguaNigerNigeriaNorth AmericaNorwayOECD membersOmanOther small statesPacific island small statesPakistanPanamaPapua New GuineaParaguayPeruPhilippinesPolandPortugalPost-demographic dividendPre-demographic dividendQatarRomaniaRussian FederationRwandaSamoaSao Tome and PrincipeSaudi ArabiaSenegalSerbiaSeychellesSierra LeoneSingaporeSlovak RepublicSloveniaSmall statesSolomon IslandsSouth AfricaSouth AsiaSouth Asia (IDA & IBRD)South SudanSpainSri LankaSt. Kitts and NevisSt. LuciaSt. Vincent and the GrenadinesSub-Saharan Africa Sub-Saharan Africa (excluding high income)Sub-Saharan Africa (IDA & IBRD countries)SudanSurinameSwazilandSwedenSwitzerlandSyrian Arab RepublicTajikistanTanzaniaThailandTimor-LesteTogoTongaTrinidad and TobagoTunisiaTurkeyUgandaUkraineUnited Arab EmiratesUnited KingdomUnited StatesUpper middle incomeUruguayVanuatuVenezuela, RBVietnamWest Bank and GazaWorldYemen, Rep.ZambiaZimbabwe Timeline:
This timeline shows a graph from 1962 to 2016 of Pacific island small states. No data until 1961. Number of actual observations by date: 55.
Source name:
World Development Indicators
Source organization:
International Monetary Fund, International Financial Statistics and data files, and World Bank and OECD GDP estimates.
Categories, topics:
Financial Sector, Private Sector
Last updated:
apr 23, 2017
Indicators value changes by year
Maximum:
70.715
jan 1, 2010
At the date of observation
Value
Absolute change
Change from previous value
jan 1, 1962
11.259
+11.259
0.0%
jan 1, 1963
9.681
-1.578
-14.02%
jan 1, 1964
9.133
-0.548
-5.66%
jan 1, 1965
9.049
-0.084
-0.92%
jan 1, 1966
9.901
+0.851
9.41%
jan 1, 1967
10.246
+0.346
3.49%
jan 1, 1968
9.791
-0.456
-4.45%
jan 1, 1969
11.237
+1.447
14.78%
jan 1, 1970
11.2
-0.037
-0.33%
jan 1, 1971
12.384
+1.184
10.57%
jan 1, 1972
14.527
+2.143
17.3%
jan 1, 1973
15.461
+0.934
6.43%
jan 1, 1974
17.045
+1.584
10.25%
jan 1, 1975
16.787
-0.258
-1.52%
jan 1, 1976
13.399
-3.387
-20.18%
jan 1, 1977
16.076
+2.677
19.98%
jan 1, 1978
17.755
+1.679
10.44%
jan 1, 1979
16.96
-0.795
-4.48%
jan 1, 1980
20.023
+3.063
18.06%
jan 1, 1981
20.384
+0.361
1.8%
jan 1, 1982
22.989
+2.606
12.78%
jan 1, 1983
21.923
-1.067
-4.64%
jan 1, 1984
23.19
+1.268
5.78%
jan 1, 1985
23.485
+0.295
1.27%
jan 1, 1986
25.29
+1.806
7.69%
jan 1, 1987
24.555
-0.736
-2.91%
jan 1, 1988
25.617
+1.062
4.33%
jan 1, 1989
25.182
-0.435
-1.7%
jan 1, 1990
28.637
+3.455
13.72%
jan 1, 1991
30.599
+1.962
6.85%
jan 1, 1992
33.045
+2.446
7.99%
jan 1, 1993
32.663
-0.382
-1.16%
jan 1, 1994
33.558
+0.895
2.74%
jan 1, 1995
32.906
-0.652
-1.94%
jan 1, 1996
33.003
+0.097
0.29%
jan 1, 1997
32.441
-0.562
-1.7%
jan 1, 1998
29.384
-3.057
-9.42%
jan 1, 1999
27.567
-1.816
-6.18%
jan 1, 2000
26.296
-1.272
-4.61%
jan 1, 2001
29.774
+3.478
13.23%
jan 1, 2002
32.562
+2.789
9.37%
jan 1, 2003
44.22
+11.657
35.8%
jan 1, 2004
44.817
+0.597
1.35%
jan 1, 2005
49.024
+4.208
9.39%
jan 1, 2006
55.773
+6.749
13.77%
jan 1, 2007
61.891
+6.117
10.97%
jan 1, 2008
64.824
+2.934
4.74%
jan 1, 2009
69.574
+4.75
7.33%
jan 1, 2010
70.715
+1.141
1.64%
jan 1, 2011
66.867
-3.848
-5.44%
jan 1, 2012
61.465
-5.403
-8.08%
jan 1, 2013
61.666
+0.201
0.33%
jan 1, 2014
63.052
+1.387
2.25%
jan 1, 2015
66.623
+3.571
5.66%
jan 1, 2016
70.116
+3.493
5.24%
Ranking of countries by current statistics by years


Comments: