29
/
en
AIzaSyAYiBZKx7MnpbEhh9jyipgxe19OcubqV5w
April 1, 2024
31478
Europe & Central Asia (excluding high income)
ECA
false
2
1
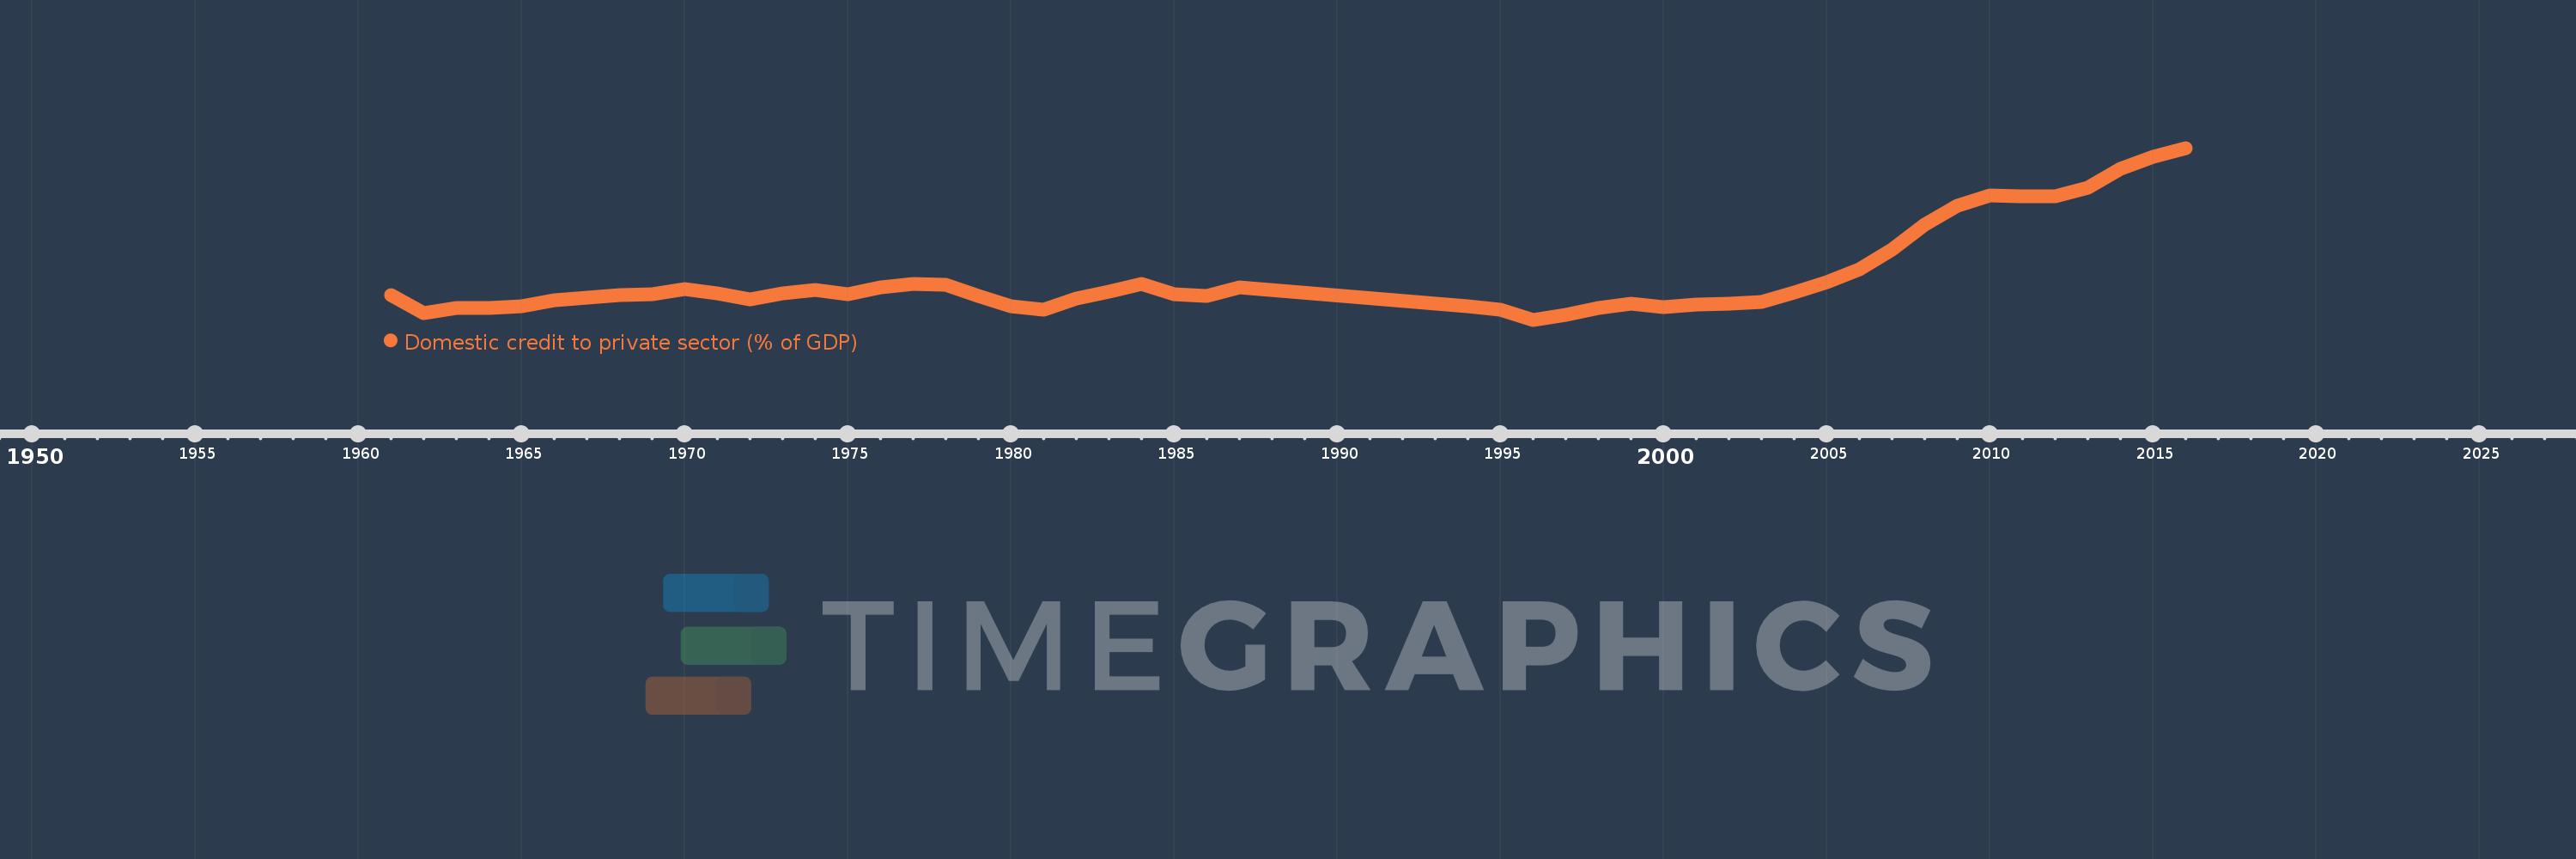
Domestic credit to private sector (% of GDP)
2016,2015,2014,2013,2012,2011,2010,2009,2008,2007,2006,2005,2004,2003,2002,2001,2000,1999,1998,1997,1996,1995,1994,1987,1986,1985,1984,1983,1982,1981,1980,1979,1978,1977,1976,1975,1974,1973,1972,1971,1970,1969,1968,1967,1966,1965,1964,1963,1962,1961
This statistics in other country:
AfghanistanAlbaniaAlgeriaAngolaAntigua and BarbudaArab WorldArgentinaArmeniaArubaAustraliaAustriaAzerbaijanBahamas, TheBahrainBangladeshBarbadosBelarusBelgiumBelizeBeninBhutanBoliviaBosnia and HerzegovinaBotswanaBrazilBrunei DarussalamBulgariaBurkina FasoBurundiCabo VerdeCambodiaCameroonCanadaCaribbean small statesCentral African RepublicCentral Europe and the BalticsChadChileChinaColombiaComorosCongo, Dem. Rep.Congo, Rep.Costa RicaCote d'IvoireCroatiaCyprusCzech RepublicDenmarkDjiboutiDominicaDominican RepublicEarly-demographic dividendEast Asia & PacificEast Asia & Pacific (excluding high income)East Asia & Pacific (IDA & IBRD countries)EcuadorEgypt, Arab Rep.El SalvadorEquatorial GuineaEritreaEstoniaEthiopiaEuro areaEurope & Central AsiaEurope & Central Asia (excluding high income)Europe & Central Asia (IDA & IBRD countries)European UnionFijiFinlandFragile and conflict affected situationsFranceGabonGambia, TheGeorgiaGermanyGhanaGreeceGrenadaGuatemalaGuineaGuinea-BissauGuyanaHaitiHeavily indebted poor countries (HIPC)High incomeHondurasHong Kong SAR, ChinaHungaryIBRD onlyIcelandIDA & IBRD totalIDA blendIDA onlyIDA totalIndiaIndonesiaIran, Islamic Rep.IraqIrelandIsraelItalyJamaicaJapanJordanKazakhstanKenyaKorea, Rep.KosovoKuwaitKyrgyz RepublicLao PDRLate-demographic dividendLatin America & Caribbean Latin America & Caribbean (excluding high income)Latin America & the Caribbean (IDA & IBRD countries)LatviaLeast developed countries: UN classificationLebanonLesothoLiberiaLibyaLithuaniaLow & middle incomeLow incomeLower middle incomeLuxembourgMacao SAR, ChinaMacedonia, FYRMadagascarMalawiMalaysiaMaldivesMaliMaltaMauritaniaMauritiusMexicoMicronesia, Fed. Sts.Middle East & North AfricaMiddle East & North Africa (excluding high income)Middle East & North Africa (IDA & IBRD countries)Middle incomeMoldovaMongoliaMontenegroMoroccoMozambiqueMyanmarNamibiaNepalNetherlandsNew ZealandNicaraguaNigerNigeriaNorth AmericaNorwayOECD membersOmanOther small statesPacific island small statesPakistanPanamaPapua New GuineaParaguayPeruPhilippinesPolandPortugalPost-demographic dividendPre-demographic dividendQatarRomaniaRussian FederationRwandaSamoaSao Tome and PrincipeSaudi ArabiaSenegalSerbiaSeychellesSierra LeoneSingaporeSlovak RepublicSloveniaSmall statesSolomon IslandsSouth AfricaSouth AsiaSouth Asia (IDA & IBRD)South SudanSpainSri LankaSt. Kitts and NevisSt. LuciaSt. Vincent and the GrenadinesSub-Saharan Africa Sub-Saharan Africa (excluding high income)Sub-Saharan Africa (IDA & IBRD countries)SudanSurinameSwazilandSwedenSwitzerlandSyrian Arab RepublicTajikistanTanzaniaThailandTimor-LesteTogoTongaTrinidad and TobagoTunisiaTurkeyUgandaUkraineUnited Arab EmiratesUnited KingdomUnited StatesUpper middle incomeUruguayVanuatuVenezuela, RBVietnamWest Bank and GazaWorldYemen, Rep.ZambiaZimbabwe Timeline:
This timeline shows a graph from 1961 to 2016 of Europe & Central Asia (excluding high income). No data until 1960. Number of actual observations by date: 50.
Source name:
World Development Indicators
Source organization:
International Monetary Fund, International Financial Statistics and data files, and World Bank and OECD GDP estimates.
Categories, topics:
Financial Sector, Private Sector
Last updated:
apr 23, 2017
Indicators value changes by year
Minimum:
10.958
jan 1, 1996
Maximum:
57.506
jan 1, 2016
At the date of observation
Value
Absolute change
Change from previous value
jan 1, 1961
17.651
+17.651
0.0%
jan 1, 1962
12.673
-4.977
-28.2%
jan 1, 1963
14.11
+1.436
11.33%
jan 1, 1964
14.056
-0.054
-0.38%
jan 1, 1965
14.702
+0.646
4.6%
jan 1, 1966
16.242
+1.54
10.48%
jan 1, 1967
16.979
+0.737
4.54%
jan 1, 1968
17.645
+0.667
3.93%
jan 1, 1969
17.822
+0.177
1.0%
jan 1, 1970
19.314
+1.492
8.37%
jan 1, 1971
18.014
-1.3
-6.73%
jan 1, 1972
16.467
-1.547
-8.59%
jan 1, 1973
18.164
+1.697
10.3%
jan 1, 1974
18.971
+0.807
4.44%
jan 1, 1975
17.935
-1.036
-5.46%
jan 1, 1976
19.728
+1.792
9.99%
jan 1, 1977
20.567
+0.839
4.25%
jan 1, 1978
20.398
-0.169
-0.82%
jan 1, 1979
17.455
-2.943
-14.43%
jan 1, 1980
14.693
-2.762
-15.82%
jan 1, 1981
13.588
-1.104
-7.52%
jan 1, 1982
16.647
+3.058
22.51%
jan 1, 1983
18.483
+1.836
11.03%
jan 1, 1984
20.76
+2.278
12.32%
jan 1, 1985
17.846
-2.914
-14.04%
jan 1, 1986
17.426
-0.421
-2.36%
jan 1, 1987
19.654
+2.228
12.79%
jan 1, 1994
14.614
-5.04
-25.64%
jan 1, 1995
13.578
-1.037
-7.09%
jan 1, 1996
10.958
-2.62
-19.29%
jan 1, 1997
12.37
+1.412
12.89%
jan 1, 1998
14.178
+1.808
14.62%
jan 1, 1999
15.37
+1.191
8.4%
jan 1, 2000
14.355
-1.014
-6.6%
jan 1, 2001
14.967
+0.612
4.26%
jan 1, 2002
15.372
+0.406
2.71%
jan 1, 2003
15.888
+0.515
3.35%
jan 1, 2004
18.264
+2.376
14.96%
jan 1, 2005
21.191
+2.927
16.03%
jan 1, 2006
24.697
+3.506
16.54%
jan 1, 2007
29.951
+5.253
21.27%
jan 1, 2008
36.726
+6.775
22.62%
jan 1, 2009
41.939
+5.213
14.19%
jan 1, 2010
44.616
+2.677
6.38%
jan 1, 2011
44.346
-0.27
-0.61%
jan 1, 2012
44.384
+0.038
0.09%
jan 1, 2013
46.808
+2.424
5.46%
jan 1, 2014
51.752
+4.944
10.56%
jan 1, 2015
54.999
+3.246
6.27%
jan 1, 2016
57.506
+2.507
4.56%
Ranking of countries by current statistics by years


Comments: