29
/
en
AIzaSyAYiBZKx7MnpbEhh9jyipgxe19OcubqV5w
April 1, 2024
27193
East Asia & Pacific
EAS
false
2
1
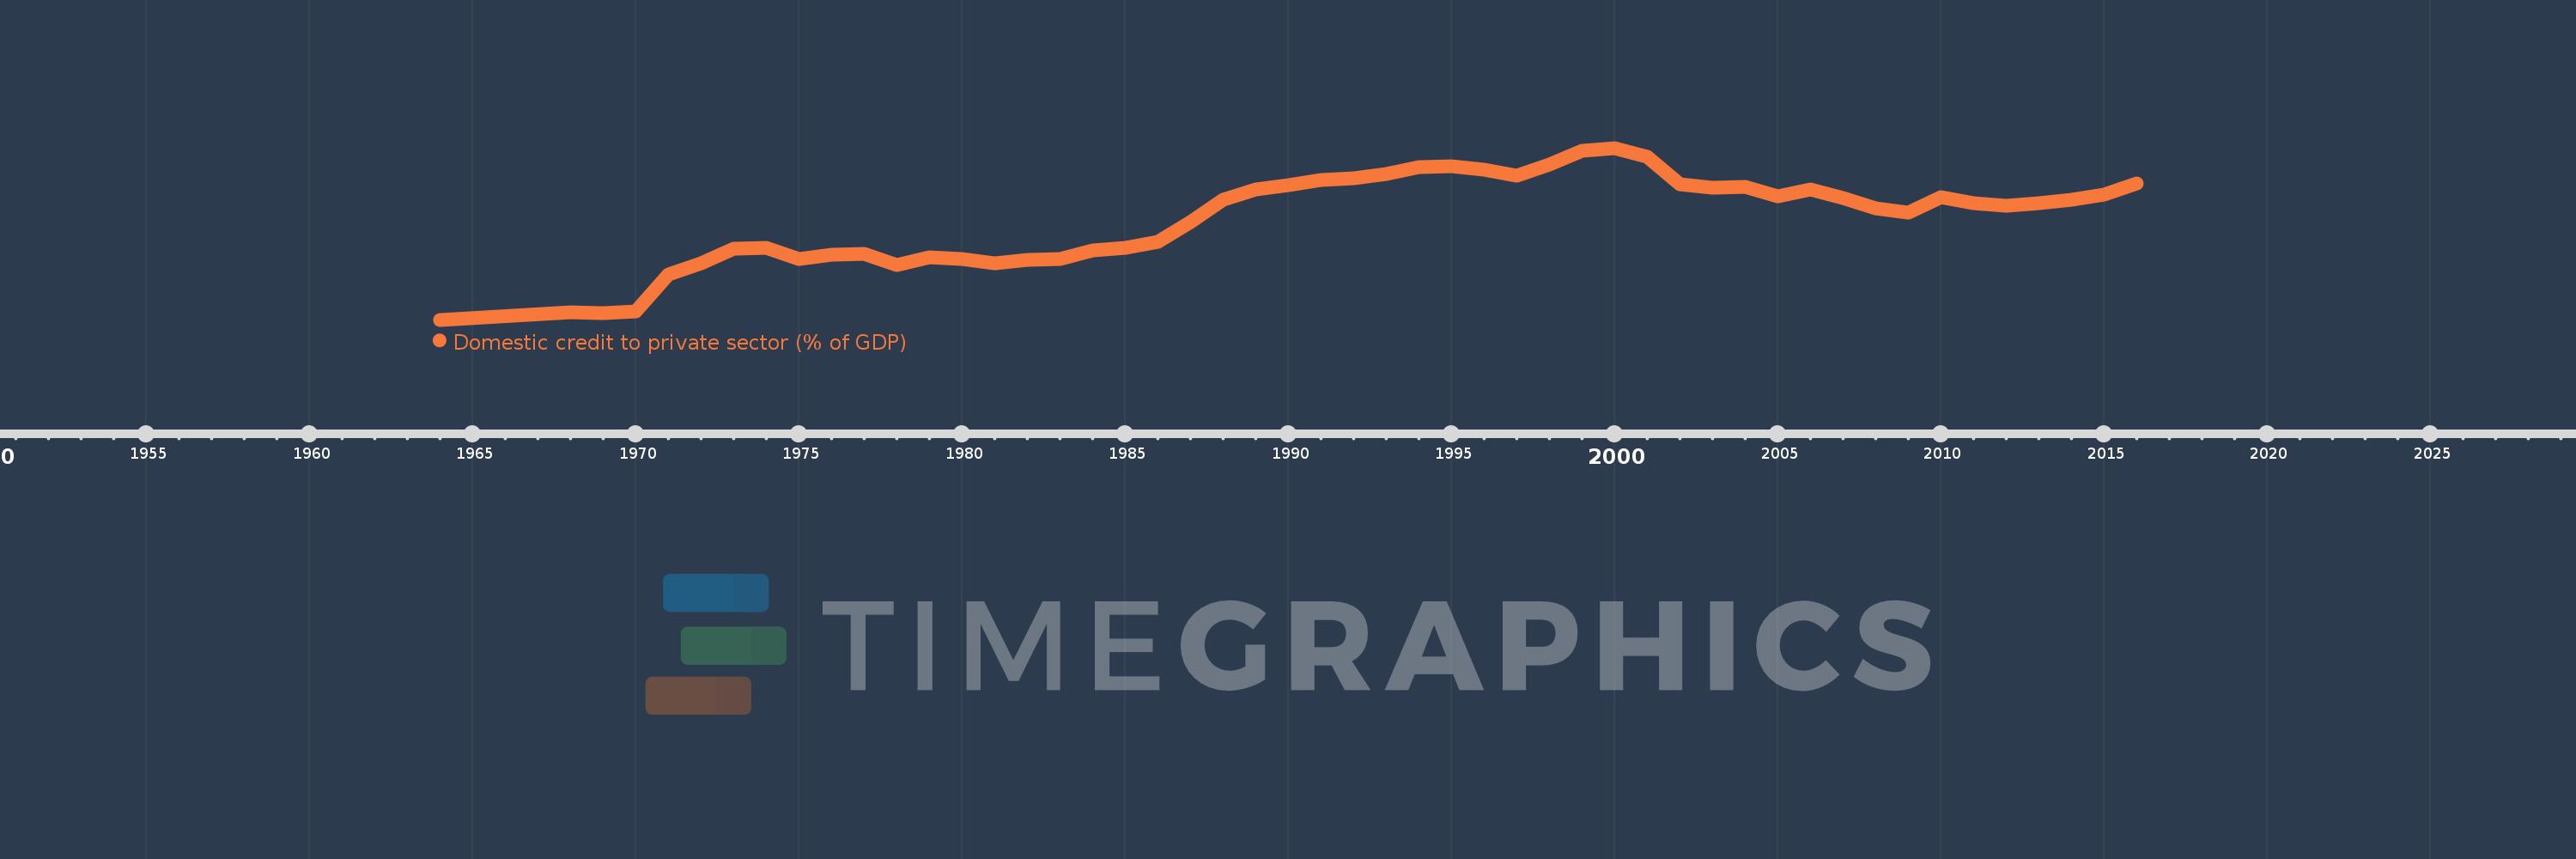
Domestic credit to private sector (% of GDP)
2016,2015,2014,2013,2012,2011,2010,2009,2008,2007,2006,2005,2004,2003,2002,2001,2000,1999,1998,1997,1996,1995,1994,1993,1992,1991,1990,1989,1988,1987,1986,1985,1984,1983,1982,1981,1980,1979,1978,1977,1976,1975,1974,1973,1972,1971,1970,1969,1968,1964
This statistics in other country:
AfghanistanAlbaniaAlgeriaAngolaAntigua and BarbudaArab WorldArgentinaArmeniaArubaAustraliaAustriaAzerbaijanBahamas, TheBahrainBangladeshBarbadosBelarusBelgiumBelizeBeninBhutanBoliviaBosnia and HerzegovinaBotswanaBrazilBrunei DarussalamBulgariaBurkina FasoBurundiCabo VerdeCambodiaCameroonCanadaCaribbean small statesCentral African RepublicCentral Europe and the BalticsChadChileChinaColombiaComorosCongo, Dem. Rep.Congo, Rep.Costa RicaCote d'IvoireCroatiaCyprusCzech RepublicDenmarkDjiboutiDominicaDominican RepublicEarly-demographic dividendEast Asia & PacificEast Asia & Pacific (excluding high income)East Asia & Pacific (IDA & IBRD countries)EcuadorEgypt, Arab Rep.El SalvadorEquatorial GuineaEritreaEstoniaEthiopiaEuro areaEurope & Central AsiaEurope & Central Asia (excluding high income)Europe & Central Asia (IDA & IBRD countries)European UnionFijiFinlandFragile and conflict affected situationsFranceGabonGambia, TheGeorgiaGermanyGhanaGreeceGrenadaGuatemalaGuineaGuinea-BissauGuyanaHaitiHeavily indebted poor countries (HIPC)High incomeHondurasHong Kong SAR, ChinaHungaryIBRD onlyIcelandIDA & IBRD totalIDA blendIDA onlyIDA totalIndiaIndonesiaIran, Islamic Rep.IraqIrelandIsraelItalyJamaicaJapanJordanKazakhstanKenyaKorea, Rep.KosovoKuwaitKyrgyz RepublicLao PDRLate-demographic dividendLatin America & Caribbean Latin America & Caribbean (excluding high income)Latin America & the Caribbean (IDA & IBRD countries)LatviaLeast developed countries: UN classificationLebanonLesothoLiberiaLibyaLithuaniaLow & middle incomeLow incomeLower middle incomeLuxembourgMacao SAR, ChinaMacedonia, FYRMadagascarMalawiMalaysiaMaldivesMaliMaltaMauritaniaMauritiusMexicoMicronesia, Fed. Sts.Middle East & North AfricaMiddle East & North Africa (excluding high income)Middle East & North Africa (IDA & IBRD countries)Middle incomeMoldovaMongoliaMontenegroMoroccoMozambiqueMyanmarNamibiaNepalNetherlandsNew ZealandNicaraguaNigerNigeriaNorth AmericaNorwayOECD membersOmanOther small statesPacific island small statesPakistanPanamaPapua New GuineaParaguayPeruPhilippinesPolandPortugalPost-demographic dividendPre-demographic dividendQatarRomaniaRussian FederationRwandaSamoaSao Tome and PrincipeSaudi ArabiaSenegalSerbiaSeychellesSierra LeoneSingaporeSlovak RepublicSloveniaSmall statesSolomon IslandsSouth AfricaSouth AsiaSouth Asia (IDA & IBRD)South SudanSpainSri LankaSt. Kitts and NevisSt. LuciaSt. Vincent and the GrenadinesSub-Saharan Africa Sub-Saharan Africa (excluding high income)Sub-Saharan Africa (IDA & IBRD countries)SudanSurinameSwazilandSwedenSwitzerlandSyrian Arab RepublicTajikistanTanzaniaThailandTimor-LesteTogoTongaTrinidad and TobagoTunisiaTurkeyUgandaUkraineUnited Arab EmiratesUnited KingdomUnited StatesUpper middle incomeUruguayVanuatuVenezuela, RBVietnamWest Bank and GazaWorldYemen, Rep.ZambiaZimbabwe Timeline:
This timeline shows a graph from 1964 to 2016 of East Asia & Pacific. No data until 1963. Number of actual observations by date: 50.
Source name:
World Development Indicators
Source organization:
International Monetary Fund, International Financial Statistics and data files, and World Bank and OECD GDP estimates.
Categories, topics:
Financial Sector, Private Sector
Last updated:
apr 23, 2017
Indicators value changes by year
Minimum:
56.584
jan 1, 1964
Maximum:
176.927
jan 1, 2000
At the date of observation
Value
Absolute change
Change from previous value
jan 1, 1964
56.584
+56.584
0.0%
jan 1, 1968
62.0
+5.417
9.57%
jan 1, 1969
61.421
-0.58
-0.94%
jan 1, 1970
62.248
+0.827
1.35%
jan 1, 1971
88.452
+26.204
42.1%
jan 1, 1972
95.915
+7.463
8.44%
jan 1, 1973
106.166
+10.251
10.69%
jan 1, 1974
106.87
+0.704
0.66%
jan 1, 1975
99.342
-7.528
-7.04%
jan 1, 1976
102.182
+2.84
2.86%
jan 1, 1977
102.667
+0.485
0.47%
jan 1, 1978
94.806
-7.861
-7.66%
jan 1, 1979
100.048
+5.242
5.53%
jan 1, 1980
98.842
-1.206
-1.2%
jan 1, 1981
96.147
-2.695
-2.73%
jan 1, 1982
98.386
+2.238
2.33%
jan 1, 1983
99.204
+0.819
0.83%
jan 1, 1984
105.289
+6.085
6.13%
jan 1, 1985
107.083
+1.793
1.7%
jan 1, 1986
111.198
+4.116
3.84%
jan 1, 1987
125.122
+13.924
12.52%
jan 1, 1988
140.663
+15.541
12.42%
jan 1, 1989
147.826
+7.164
5.09%
jan 1, 1990
151.106
+3.279
2.22%
jan 1, 1991
154.288
+3.182
2.11%
jan 1, 1992
155.565
+1.277
0.83%
jan 1, 1993
158.792
+3.228
2.07%
jan 1, 1994
163.278
+4.486
2.82%
jan 1, 1995
164.049
+0.771
0.47%
jan 1, 1996
161.757
-2.293
-1.4%
jan 1, 1997
157.774
-3.983
-2.46%
jan 1, 1998
165.114
+7.34
4.65%
jan 1, 1999
174.927
+9.813
5.94%
jan 1, 2000
176.927
+1.999
1.14%
jan 1, 2001
170.449
-6.478
-3.66%
jan 1, 2002
151.746
-18.703
-10.97%
jan 1, 2003
149.254
-2.492
-1.64%
jan 1, 2004
149.887
+0.633
0.42%
jan 1, 2005
143.184
-6.703
-4.47%
jan 1, 2006
147.691
+4.507
3.15%
jan 1, 2007
142.093
-5.599
-3.79%
jan 1, 2008
134.717
-7.376
-5.19%
jan 1, 2009
131.814
-2.903
-2.15%
jan 1, 2010
142.274
+10.46
7.94%
jan 1, 2011
138.395
-3.878
-2.73%
jan 1, 2012
136.193
-2.202
-1.59%
jan 1, 2013
138.523
+2.329
1.71%
jan 1, 2014
140.823
+2.3
1.66%
jan 1, 2015
144.331
+3.508
2.49%
jan 1, 2016
152.212
+7.881
5.46%
Ranking of countries by current statistics by years


Comments: