29
/
en
AIzaSyAYiBZKx7MnpbEhh9jyipgxe19OcubqV5w
April 1, 2024
161338
Italy
ITA
true
2
1
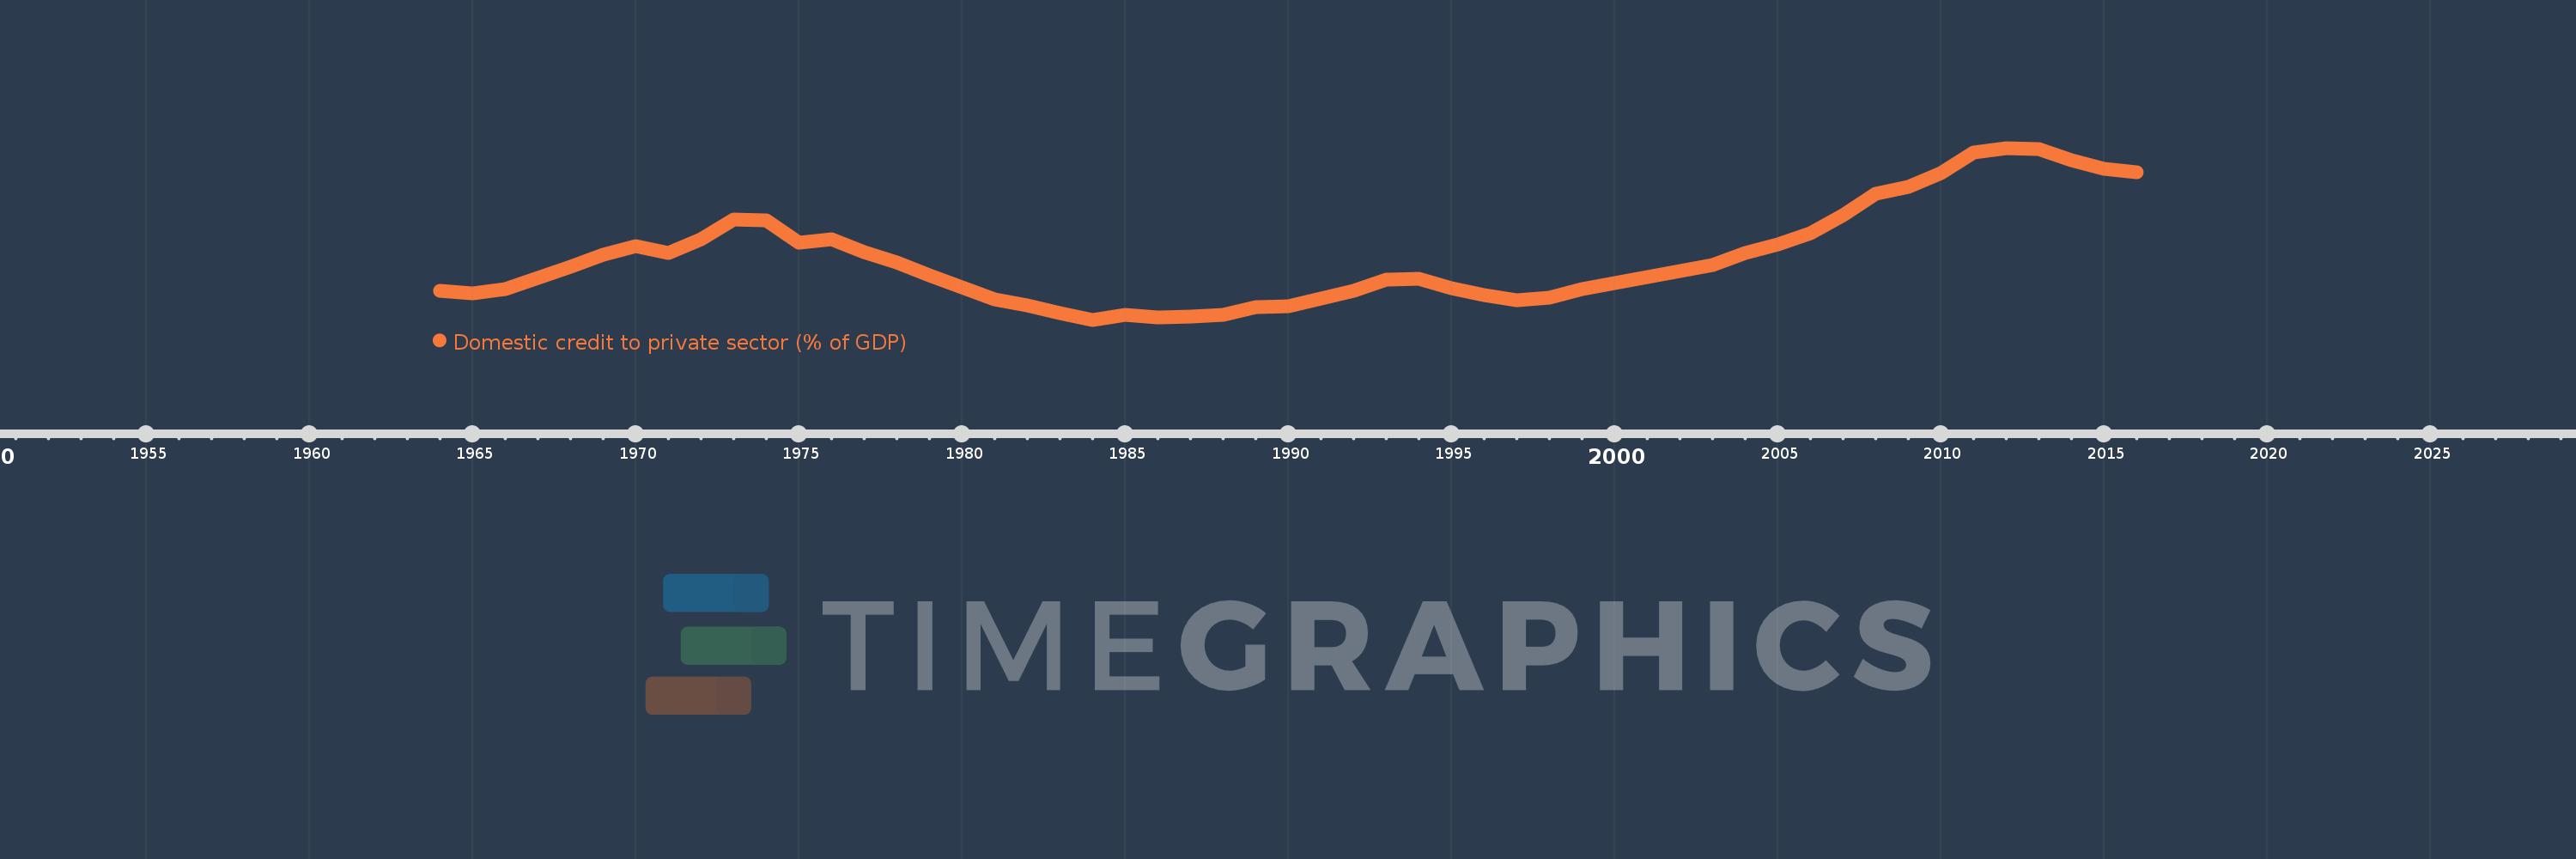
Domestic credit to private sector (% of GDP)
2016,2015,2014,2013,2012,2011,2010,2009,2008,2007,2006,2005,2004,2003,2002,1999,1998,1997,1996,1995,1994,1993,1992,1991,1990,1989,1988,1987,1986,1985,1984,1983,1982,1981,1980,1979,1978,1977,1976,1975,1974,1973,1972,1971,1970,1969,1968,1967,1966,1965,1964
This statistics in other country:
AfghanistanAlbaniaAlgeriaAngolaAntigua and BarbudaArab WorldArgentinaArmeniaArubaAustraliaAustriaAzerbaijanBahamas, TheBahrainBangladeshBarbadosBelarusBelgiumBelizeBeninBhutanBoliviaBosnia and HerzegovinaBotswanaBrazilBrunei DarussalamBulgariaBurkina FasoBurundiCabo VerdeCambodiaCameroonCanadaCaribbean small statesCentral African RepublicCentral Europe and the BalticsChadChileChinaColombiaComorosCongo, Dem. Rep.Congo, Rep.Costa RicaCote d'IvoireCroatiaCyprusCzech RepublicDenmarkDjiboutiDominicaDominican RepublicEarly-demographic dividendEast Asia & PacificEast Asia & Pacific (excluding high income)East Asia & Pacific (IDA & IBRD countries)EcuadorEgypt, Arab Rep.El SalvadorEquatorial GuineaEritreaEstoniaEthiopiaEuro areaEurope & Central AsiaEurope & Central Asia (excluding high income)Europe & Central Asia (IDA & IBRD countries)European UnionFijiFinlandFragile and conflict affected situationsFranceGabonGambia, TheGeorgiaGermanyGhanaGreeceGrenadaGuatemalaGuineaGuinea-BissauGuyanaHaitiHeavily indebted poor countries (HIPC)High incomeHondurasHong Kong SAR, ChinaHungaryIBRD onlyIcelandIDA & IBRD totalIDA blendIDA onlyIDA totalIndiaIndonesiaIran, Islamic Rep.IraqIrelandIsraelItalyJamaicaJapanJordanKazakhstanKenyaKorea, Rep.KosovoKuwaitKyrgyz RepublicLao PDRLate-demographic dividendLatin America & Caribbean Latin America & Caribbean (excluding high income)Latin America & the Caribbean (IDA & IBRD countries)LatviaLeast developed countries: UN classificationLebanonLesothoLiberiaLibyaLithuaniaLow & middle incomeLow incomeLower middle incomeLuxembourgMacao SAR, ChinaMacedonia, FYRMadagascarMalawiMalaysiaMaldivesMaliMaltaMauritaniaMauritiusMexicoMicronesia, Fed. Sts.Middle East & North AfricaMiddle East & North Africa (excluding high income)Middle East & North Africa (IDA & IBRD countries)Middle incomeMoldovaMongoliaMontenegroMoroccoMozambiqueMyanmarNamibiaNepalNetherlandsNew ZealandNicaraguaNigerNigeriaNorth AmericaNorwayOECD membersOmanOther small statesPacific island small statesPakistanPanamaPapua New GuineaParaguayPeruPhilippinesPolandPortugalPost-demographic dividendPre-demographic dividendQatarRomaniaRussian FederationRwandaSamoaSao Tome and PrincipeSaudi ArabiaSenegalSerbiaSeychellesSierra LeoneSingaporeSlovak RepublicSloveniaSmall statesSolomon IslandsSouth AfricaSouth AsiaSouth Asia (IDA & IBRD)South SudanSpainSri LankaSt. Kitts and NevisSt. LuciaSt. Vincent and the GrenadinesSub-Saharan Africa Sub-Saharan Africa (excluding high income)Sub-Saharan Africa (IDA & IBRD countries)SudanSurinameSwazilandSwedenSwitzerlandSyrian Arab RepublicTajikistanTanzaniaThailandTimor-LesteTogoTongaTrinidad and TobagoTunisiaTurkeyUgandaUkraineUnited Arab EmiratesUnited KingdomUnited StatesUpper middle incomeUruguayVanuatuVenezuela, RBVietnamWest Bank and GazaWorldYemen, Rep.ZambiaZimbabwe Timeline:
This timeline shows a graph from 1964 to 2016 of Italy. No data until 1963. Number of actual observations by date: 51.
Source name:
World Development Indicators
Source organization:
International Monetary Fund, International Financial Statistics and data files, and World Bank and OECD GDP estimates.
Categories, topics:
Financial Sector, Private Sector
Last updated:
apr 23, 2017
Indicators value changes by year
Minimum:
47.087
jan 1, 1984
Maximum:
94.709
jan 1, 2012
At the date of observation
Value
Absolute change
Change from previous value
jan 1, 1964
55.069
+55.069
0.0%
jan 1, 1965
54.484
-0.585
-1.06%
jan 1, 1966
55.616
+1.131
2.08%
jan 1, 1967
58.732
+3.117
5.6%
jan 1, 1968
61.858
+3.126
5.32%
jan 1, 1969
65.021
+3.163
5.11%
jan 1, 1970
67.591
+2.57
3.95%
jan 1, 1971
65.657
-1.934
-2.86%
jan 1, 1972
69.487
+3.83
5.83%
jan 1, 1973
74.874
+5.387
7.75%
jan 1, 1974
74.656
-0.218
-0.29%
jan 1, 1975
68.461
-6.195
-8.3%
jan 1, 1976
69.419
+0.959
1.4%
jan 1, 1977
65.794
-3.625
-5.22%
jan 1, 1978
62.918
-2.877
-4.37%
jan 1, 1979
59.385
-3.533
-5.61%
jan 1, 1980
56.163
-3.221
-5.42%
jan 1, 1981
52.832
-3.332
-5.93%
jan 1, 1982
51.132
-1.7
-3.22%
jan 1, 1983
49.011
-2.121
-4.15%
jan 1, 1984
47.087
-1.923
-3.92%
jan 1, 1985
48.446
+1.359
2.89%
jan 1, 1986
47.809
-0.636
-1.31%
jan 1, 1987
47.887
+0.078
0.16%
jan 1, 1988
48.396
+0.509
1.06%
jan 1, 1989
50.568
+2.173
4.49%
jan 1, 1990
50.797
+0.229
0.45%
jan 1, 1991
52.876
+2.079
4.09%
jan 1, 1992
55.222
+2.346
4.44%
jan 1, 1993
58.152
+2.93
5.31%
jan 1, 1994
58.33
+0.179
0.31%
jan 1, 1995
55.71
-2.62
-4.49%
jan 1, 1996
54.024
-1.687
-3.03%
jan 1, 1997
52.504
-1.52
-2.81%
jan 1, 1998
53.241
+0.737
1.4%
jan 1, 1999
55.687
+2.446
4.59%
jan 1, 2002
60.594
+4.906
8.81%
jan 1, 2003
62.268
+1.674
2.76%
jan 1, 2004
65.521
+3.252
5.22%
jan 1, 2005
67.913
+2.392
3.65%
jan 1, 2006
71.037
+3.124
4.6%
jan 1, 2007
75.978
+4.941
6.96%
jan 1, 2008
82.069
+6.091
8.02%
jan 1, 2009
83.973
+1.905
2.32%
jan 1, 2010
87.809
+3.835
4.57%
jan 1, 2011
93.443
+5.635
6.42%
jan 1, 2012
94.709
+1.266
1.35%
jan 1, 2013
94.404
-0.305
-0.32%
jan 1, 2014
91.303
-3.101
-3.28%
jan 1, 2015
89.034
-2.269
-2.49%
jan 1, 2016
88.045
-0.989
-1.11%
Ranking of countries by current statistics by years


Comments: