29
/
en
AIzaSyAYiBZKx7MnpbEhh9jyipgxe19OcubqV5w
April 1, 2024
105845
China
CHN
true
2
1
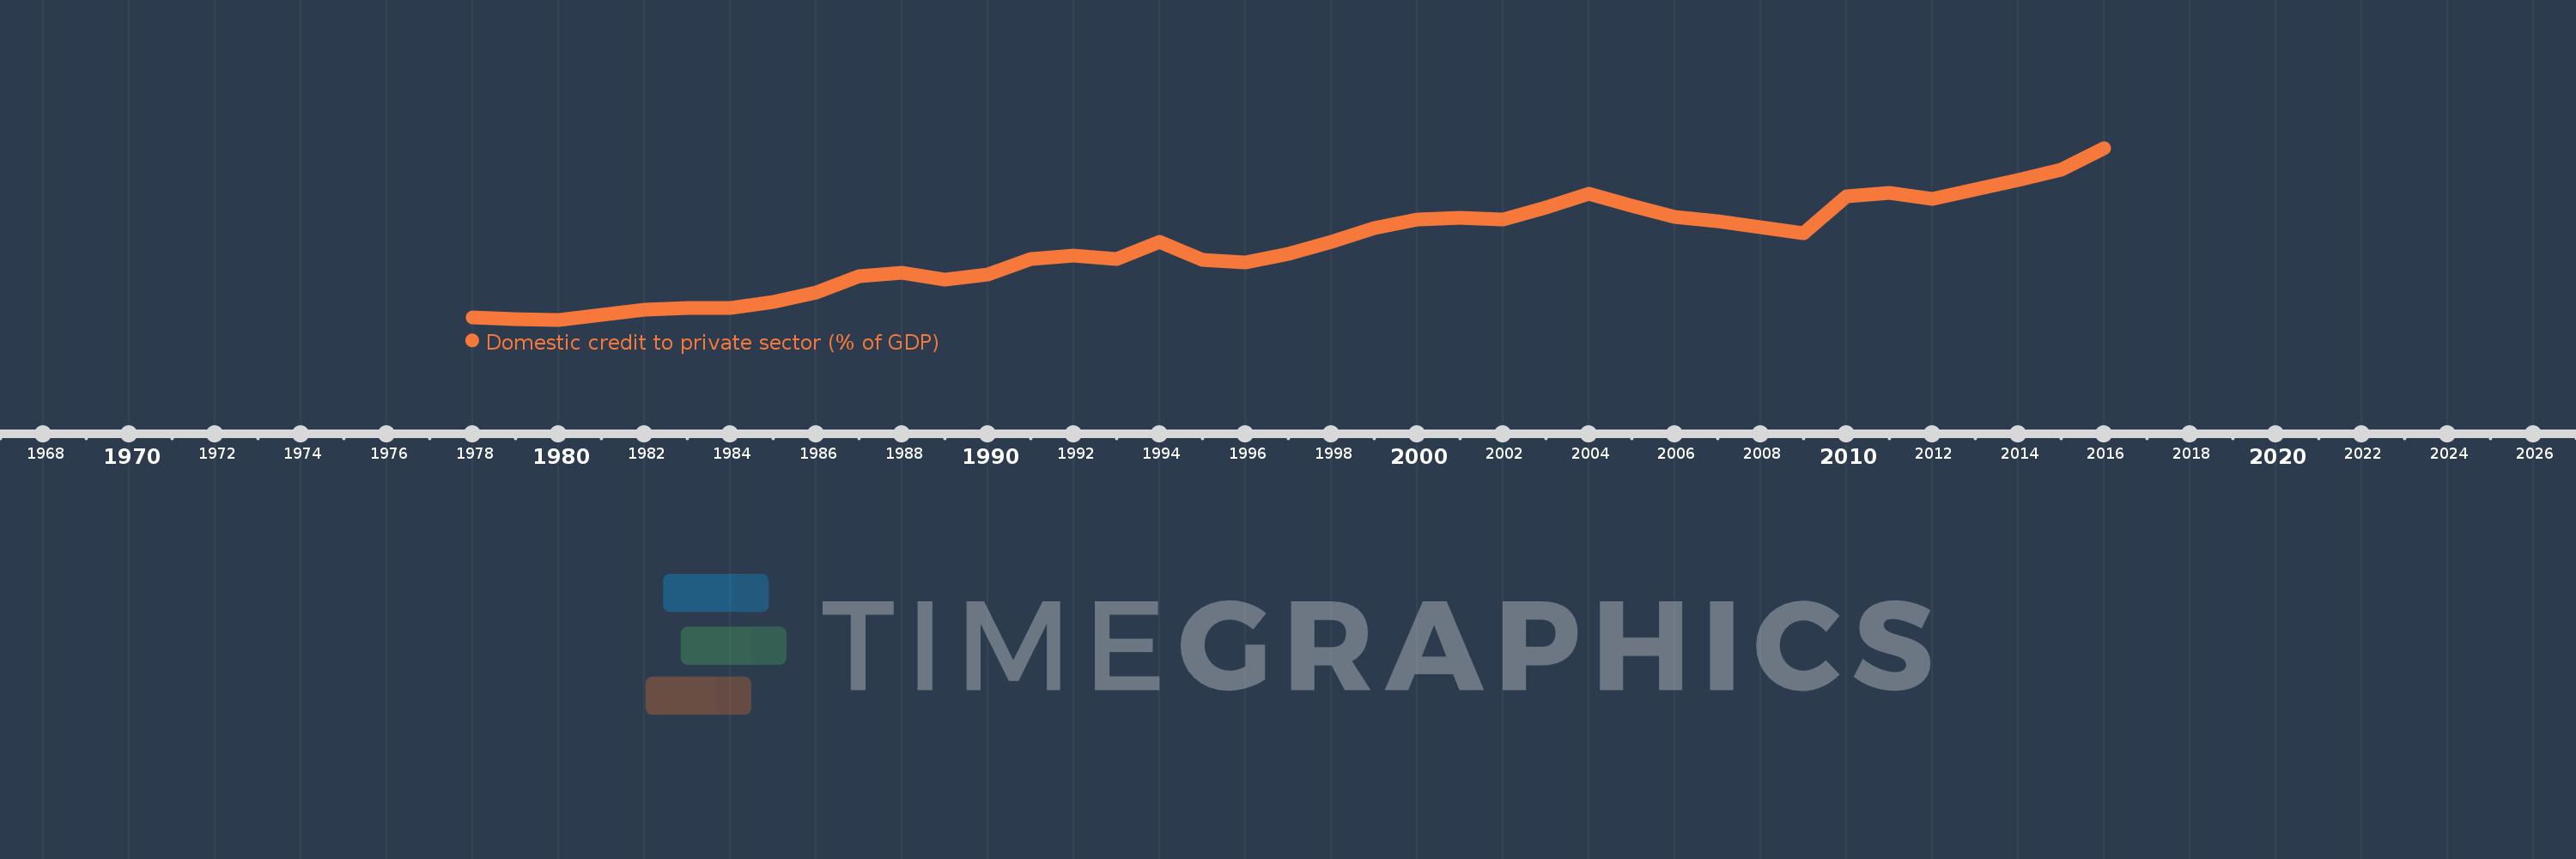
Domestic credit to private sector (% of GDP)
2016,2015,2014,2013,2012,2011,2010,2009,2008,2007,2006,2005,2004,2003,2002,2001,2000,1999,1998,1997,1996,1995,1994,1993,1992,1991,1990,1989,1988,1987,1986,1985,1984,1983,1982,1981,1980,1979,1978
This statistics in other country:
AfghanistanAlbaniaAlgeriaAngolaAntigua and BarbudaArab WorldArgentinaArmeniaArubaAustraliaAustriaAzerbaijanBahamas, TheBahrainBangladeshBarbadosBelarusBelgiumBelizeBeninBhutanBoliviaBosnia and HerzegovinaBotswanaBrazilBrunei DarussalamBulgariaBurkina FasoBurundiCabo VerdeCambodiaCameroonCanadaCaribbean small statesCentral African RepublicCentral Europe and the BalticsChadChileChinaColombiaComorosCongo, Dem. Rep.Congo, Rep.Costa RicaCote d'IvoireCroatiaCyprusCzech RepublicDenmarkDjiboutiDominicaDominican RepublicEarly-demographic dividendEast Asia & PacificEast Asia & Pacific (excluding high income)East Asia & Pacific (IDA & IBRD countries)EcuadorEgypt, Arab Rep.El SalvadorEquatorial GuineaEritreaEstoniaEthiopiaEuro areaEurope & Central AsiaEurope & Central Asia (excluding high income)Europe & Central Asia (IDA & IBRD countries)European UnionFijiFinlandFragile and conflict affected situationsFranceGabonGambia, TheGeorgiaGermanyGhanaGreeceGrenadaGuatemalaGuineaGuinea-BissauGuyanaHaitiHeavily indebted poor countries (HIPC)High incomeHondurasHong Kong SAR, ChinaHungaryIBRD onlyIcelandIDA & IBRD totalIDA blendIDA onlyIDA totalIndiaIndonesiaIran, Islamic Rep.IraqIrelandIsraelItalyJamaicaJapanJordanKazakhstanKenyaKorea, Rep.KosovoKuwaitKyrgyz RepublicLao PDRLate-demographic dividendLatin America & Caribbean Latin America & Caribbean (excluding high income)Latin America & the Caribbean (IDA & IBRD countries)LatviaLeast developed countries: UN classificationLebanonLesothoLiberiaLibyaLithuaniaLow & middle incomeLow incomeLower middle incomeLuxembourgMacao SAR, ChinaMacedonia, FYRMadagascarMalawiMalaysiaMaldivesMaliMaltaMauritaniaMauritiusMexicoMicronesia, Fed. Sts.Middle East & North AfricaMiddle East & North Africa (excluding high income)Middle East & North Africa (IDA & IBRD countries)Middle incomeMoldovaMongoliaMontenegroMoroccoMozambiqueMyanmarNamibiaNepalNetherlandsNew ZealandNicaraguaNigerNigeriaNorth AmericaNorwayOECD membersOmanOther small statesPacific island small statesPakistanPanamaPapua New GuineaParaguayPeruPhilippinesPolandPortugalPost-demographic dividendPre-demographic dividendQatarRomaniaRussian FederationRwandaSamoaSao Tome and PrincipeSaudi ArabiaSenegalSerbiaSeychellesSierra LeoneSingaporeSlovak RepublicSloveniaSmall statesSolomon IslandsSouth AfricaSouth AsiaSouth Asia (IDA & IBRD)South SudanSpainSri LankaSt. Kitts and NevisSt. LuciaSt. Vincent and the GrenadinesSub-Saharan Africa Sub-Saharan Africa (excluding high income)Sub-Saharan Africa (IDA & IBRD countries)SudanSurinameSwazilandSwedenSwitzerlandSyrian Arab RepublicTajikistanTanzaniaThailandTimor-LesteTogoTongaTrinidad and TobagoTunisiaTurkeyUgandaUkraineUnited Arab EmiratesUnited KingdomUnited StatesUpper middle incomeUruguayVanuatuVenezuela, RBVietnamWest Bank and GazaWorldYemen, Rep.ZambiaZimbabwe Timeline:
This timeline shows a graph from 1978 to 2016 of China. No data until 1977. Number of actual observations by date: 39.
Source name:
World Development Indicators
Source organization:
International Monetary Fund, International Financial Statistics and data files, and World Bank and OECD GDP estimates.
Categories, topics:
Financial Sector, Private Sector
Last updated:
apr 23, 2017
Indicators value changes by year
Maximum:
153.341
jan 1, 2016
At the date of observation
Value
Absolute change
Change from previous value
jan 1, 1978
51.178
+51.178
0.0%
jan 1, 1979
50.29
-0.889
-1.74%
jan 1, 1980
49.74
-0.549
-1.09%
jan 1, 1981
52.627
+2.886
5.8%
jan 1, 1982
56.013
+3.387
6.44%
jan 1, 1983
56.804
+0.791
1.41%
jan 1, 1984
56.986
+0.183
0.32%
jan 1, 1985
60.721
+3.735
6.55%
jan 1, 1986
66.193
+5.471
9.01%
jan 1, 1987
75.974
+9.781
14.78%
jan 1, 1988
78.037
+2.063
2.72%
jan 1, 1989
73.984
-4.054
-5.19%
jan 1, 1990
77.133
+3.15
4.26%
jan 1, 1991
86.2
+9.067
11.75%
jan 1, 1992
88.363
+2.162
2.51%
jan 1, 1993
86.373
-1.99
-2.25%
jan 1, 1994
96.903
+10.53
12.19%
jan 1, 1995
85.882
-11.02
-11.37%
jan 1, 1996
84.206
-1.676
-1.95%
jan 1, 1997
89.456
+5.25
6.23%
jan 1, 1998
96.726
+7.27
8.13%
jan 1, 1999
105.193
+8.467
8.75%
jan 1, 2000
110.383
+5.19
4.93%
jan 1, 2001
111.123
+0.74
0.67%
jan 1, 2002
110.045
-1.078
-0.97%
jan 1, 2003
117.499
+7.454
6.77%
jan 1, 2004
125.671
+8.173
6.96%
jan 1, 2005
118.636
-7.035
-5.6%
jan 1, 2006
111.843
-6.793
-5.73%
jan 1, 2007
109.158
-2.685
-2.4%
jan 1, 2008
105.733
-3.426
-3.14%
jan 1, 2009
101.917
-3.816
-3.61%
jan 1, 2010
124.207
+22.29
21.87%
jan 1, 2011
126.3
+2.093
1.69%
jan 1, 2012
122.754
-3.547
-2.81%
jan 1, 2013
128.496
+5.743
4.68%
jan 1, 2014
133.804
+5.308
4.13%
jan 1, 2015
140.147
+6.343
4.74%
jan 1, 2016
153.341
+13.193
9.41%
Ranking of countries by current statistics by years


Comments: