29
/
en
AIzaSyAYiBZKx7MnpbEhh9jyipgxe19OcubqV5w
April 1, 2024
150220
Honduras
HND
true
2
1
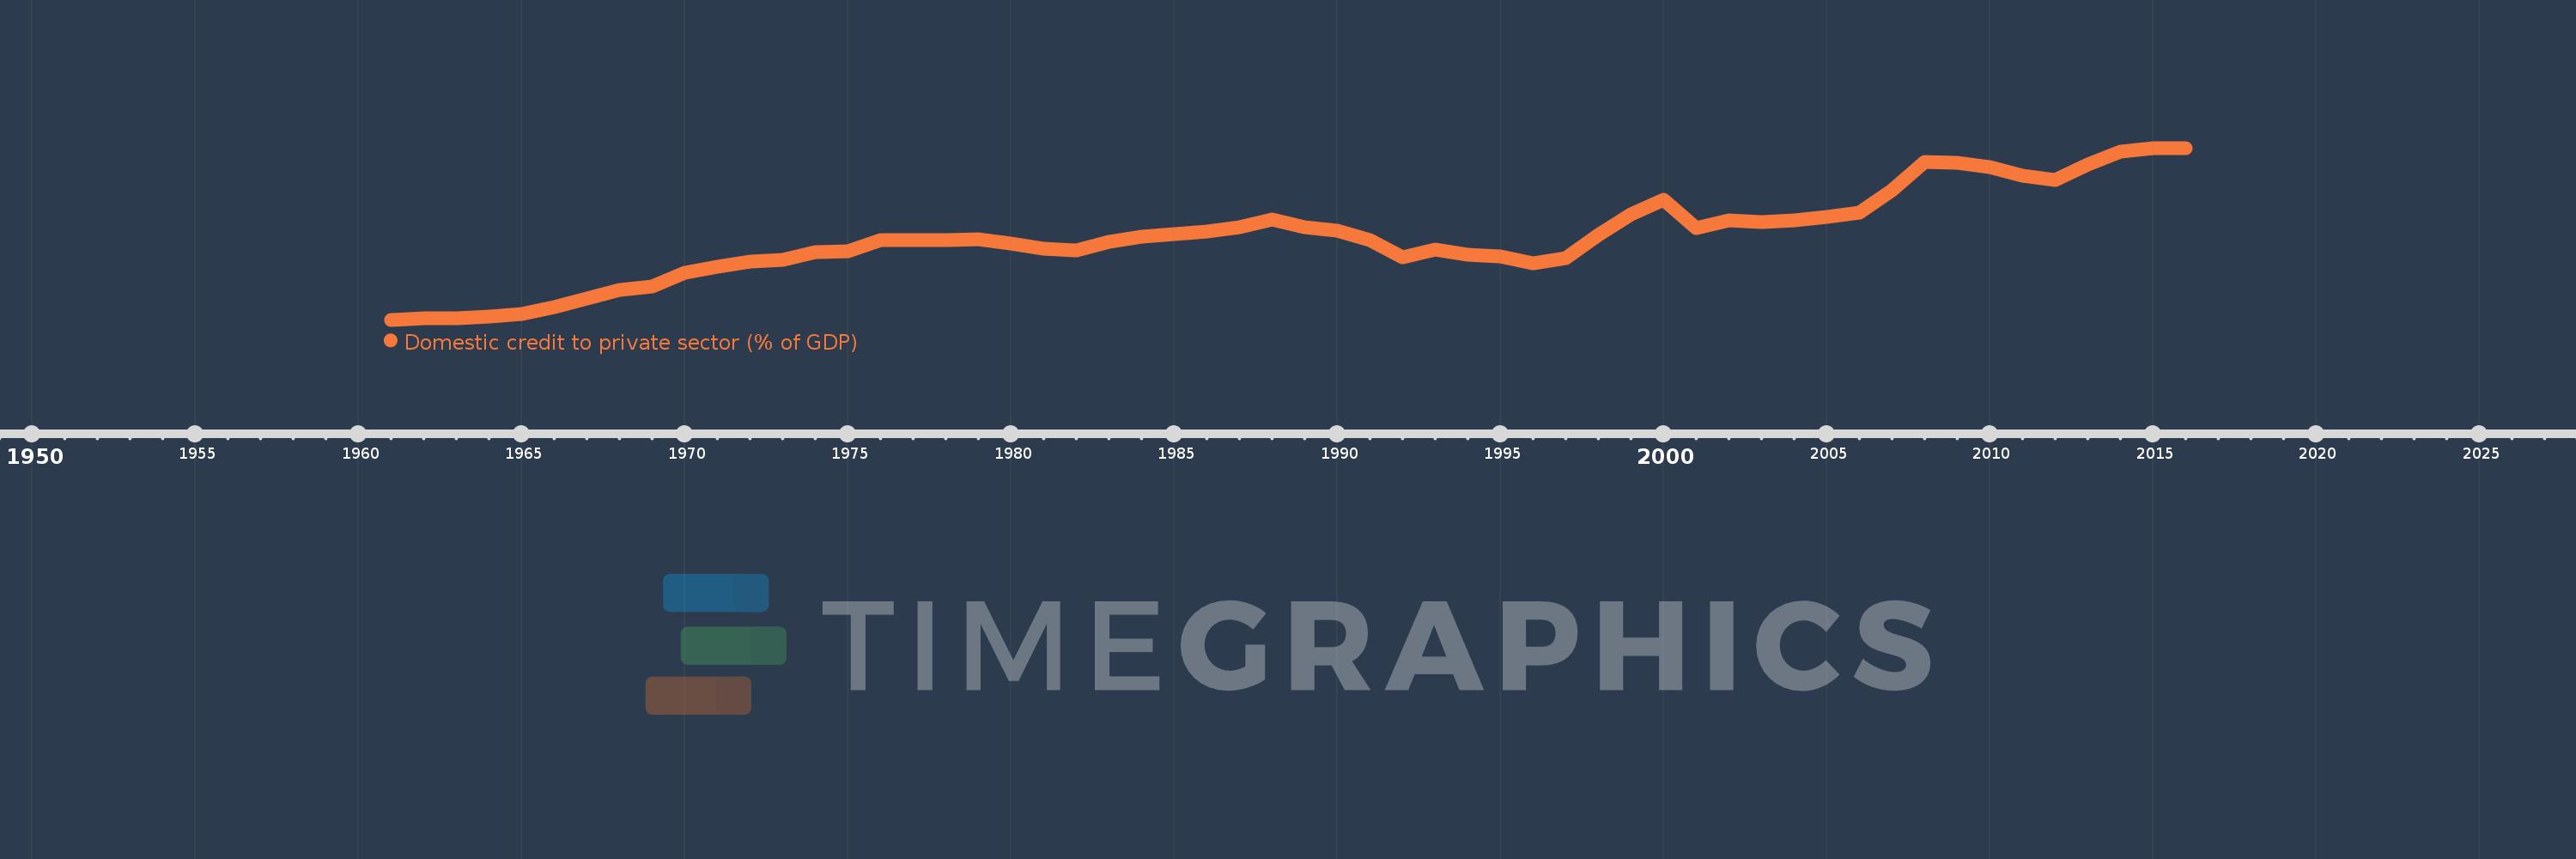
Domestic credit to private sector (% of GDP)
2016,2015,2014,2013,2012,2011,2010,2009,2008,2007,2006,2005,2004,2003,2002,2001,2000,1999,1998,1997,1996,1995,1994,1993,1992,1991,1990,1989,1988,1987,1986,1985,1984,1983,1982,1981,1980,1979,1978,1977,1976,1975,1974,1973,1972,1971,1970,1969,1968,1967,1966,1965,1964,1963,1962,1961
This statistics in other country:
AfghanistanAlbaniaAlgeriaAngolaAntigua and BarbudaArab WorldArgentinaArmeniaArubaAustraliaAustriaAzerbaijanBahamas, TheBahrainBangladeshBarbadosBelarusBelgiumBelizeBeninBhutanBoliviaBosnia and HerzegovinaBotswanaBrazilBrunei DarussalamBulgariaBurkina FasoBurundiCabo VerdeCambodiaCameroonCanadaCaribbean small statesCentral African RepublicCentral Europe and the BalticsChadChileChinaColombiaComorosCongo, Dem. Rep.Congo, Rep.Costa RicaCote d'IvoireCroatiaCyprusCzech RepublicDenmarkDjiboutiDominicaDominican RepublicEarly-demographic dividendEast Asia & PacificEast Asia & Pacific (excluding high income)East Asia & Pacific (IDA & IBRD countries)EcuadorEgypt, Arab Rep.El SalvadorEquatorial GuineaEritreaEstoniaEthiopiaEuro areaEurope & Central AsiaEurope & Central Asia (excluding high income)Europe & Central Asia (IDA & IBRD countries)European UnionFijiFinlandFragile and conflict affected situationsFranceGabonGambia, TheGeorgiaGermanyGhanaGreeceGrenadaGuatemalaGuineaGuinea-BissauGuyanaHaitiHeavily indebted poor countries (HIPC)High incomeHondurasHong Kong SAR, ChinaHungaryIBRD onlyIcelandIDA & IBRD totalIDA blendIDA onlyIDA totalIndiaIndonesiaIran, Islamic Rep.IraqIrelandIsraelItalyJamaicaJapanJordanKazakhstanKenyaKorea, Rep.KosovoKuwaitKyrgyz RepublicLao PDRLate-demographic dividendLatin America & Caribbean Latin America & Caribbean (excluding high income)Latin America & the Caribbean (IDA & IBRD countries)LatviaLeast developed countries: UN classificationLebanonLesothoLiberiaLibyaLithuaniaLow & middle incomeLow incomeLower middle incomeLuxembourgMacao SAR, ChinaMacedonia, FYRMadagascarMalawiMalaysiaMaldivesMaliMaltaMauritaniaMauritiusMexicoMicronesia, Fed. Sts.Middle East & North AfricaMiddle East & North Africa (excluding high income)Middle East & North Africa (IDA & IBRD countries)Middle incomeMoldovaMongoliaMontenegroMoroccoMozambiqueMyanmarNamibiaNepalNetherlandsNew ZealandNicaraguaNigerNigeriaNorth AmericaNorwayOECD membersOmanOther small statesPacific island small statesPakistanPanamaPapua New GuineaParaguayPeruPhilippinesPolandPortugalPost-demographic dividendPre-demographic dividendQatarRomaniaRussian FederationRwandaSamoaSao Tome and PrincipeSaudi ArabiaSenegalSerbiaSeychellesSierra LeoneSingaporeSlovak RepublicSloveniaSmall statesSolomon IslandsSouth AfricaSouth AsiaSouth Asia (IDA & IBRD)South SudanSpainSri LankaSt. Kitts and NevisSt. LuciaSt. Vincent and the GrenadinesSub-Saharan Africa Sub-Saharan Africa (excluding high income)Sub-Saharan Africa (IDA & IBRD countries)SudanSurinameSwazilandSwedenSwitzerlandSyrian Arab RepublicTajikistanTanzaniaThailandTimor-LesteTogoTongaTrinidad and TobagoTunisiaTurkeyUgandaUkraineUnited Arab EmiratesUnited KingdomUnited StatesUpper middle incomeUruguayVanuatuVenezuela, RBVietnamWest Bank and GazaWorldYemen, Rep.ZambiaZimbabwe Timeline:
This timeline shows a graph from 1961 to 2016 of Honduras. No data until 1960. Number of actual observations by date: 56.
Source name:
World Development Indicators
Source organization:
International Monetary Fund, International Financial Statistics and data files, and World Bank and OECD GDP estimates.
Categories, topics:
Financial Sector, Private Sector
Last updated:
apr 23, 2017
Indicators value changes by year
Maximum:
55.375
jan 1, 2016
At the date of observation
Value
Absolute change
Change from previous value
jan 1, 1961
9.936
+9.936
0.0%
jan 1, 1962
10.233
+0.297
2.99%
jan 1, 1963
10.29
+0.057
0.56%
jan 1, 1964
10.714
+0.424
4.12%
jan 1, 1965
11.411
+0.697
6.51%
jan 1, 1966
13.251
+1.839
16.12%
jan 1, 1967
15.465
+2.214
16.71%
jan 1, 1968
17.882
+2.417
15.63%
jan 1, 1969
18.754
+0.872
4.88%
jan 1, 1970
22.365
+3.611
19.26%
jan 1, 1971
24.025
+1.66
7.42%
jan 1, 1972
25.253
+1.228
5.11%
jan 1, 1973
25.753
+0.5
1.98%
jan 1, 1974
27.808
+2.055
7.98%
jan 1, 1975
28.149
+0.341
1.22%
jan 1, 1976
31.019
+2.87
10.2%
jan 1, 1977
31.105
+0.087
0.28%
jan 1, 1978
31.087
-0.018
-0.06%
jan 1, 1979
31.125
+0.037
0.12%
jan 1, 1980
30.198
-0.927
-2.98%
jan 1, 1981
28.786
-1.412
-4.67%
jan 1, 1982
28.195
-0.591
-2.05%
jan 1, 1983
30.53
+2.336
8.28%
jan 1, 1984
31.95
+1.42
4.65%
jan 1, 1985
32.525
+0.575
1.8%
jan 1, 1986
33.367
+0.842
2.59%
jan 1, 1987
34.494
+1.127
3.38%
jan 1, 1988
36.411
+1.917
5.56%
jan 1, 1989
34.471
-1.94
-5.33%
jan 1, 1990
33.521
-0.949
-2.75%
jan 1, 1991
31.087
-2.434
-7.26%
jan 1, 1992
26.348
-4.739
-15.25%
jan 1, 1993
28.532
+2.184
8.29%
jan 1, 1994
27.155
-1.376
-4.82%
jan 1, 1995
26.621
-0.534
-1.97%
jan 1, 1996
24.807
-1.814
-6.81%
jan 1, 1997
26.234
+1.427
5.75%
jan 1, 1998
32.27
+6.036
23.01%
jan 1, 1999
37.742
+5.472
16.96%
jan 1, 2000
41.585
+3.843
10.18%
jan 1, 2001
34.114
-7.471
-17.96%
jan 1, 2002
36.276
+2.162
6.34%
jan 1, 2003
35.699
-0.578
-1.59%
jan 1, 2004
36.291
+0.592
1.66%
jan 1, 2005
37.204
+0.914
2.52%
jan 1, 2006
38.257
+1.052
2.83%
jan 1, 2007
44.136
+5.88
15.37%
jan 1, 2008
51.647
+7.511
17.02%
jan 1, 2009
51.343
-0.304
-0.59%
jan 1, 2010
50.306
-1.036
-2.02%
jan 1, 2011
47.934
-2.372
-4.72%
jan 1, 2012
46.94
-0.994
-2.07%
jan 1, 2013
50.897
+3.957
8.43%
jan 1, 2014
54.295
+3.398
6.68%
jan 1, 2015
55.259
+0.964
1.78%
jan 1, 2016
55.375
+0.115
0.21%
Ranking of countries by current statistics by years


Comments: